🏆 20 points available
▶️ Run the code cell below to import unittest, a module used for 🧭 Check Your Work sections and the autograder.
import unittest
import base64
import plotly

tc = unittest.TestCase()
🎯 Exercise 1: Import Packages
👇 Tasks
✔️ Import the following Python packages.
pandas: Use aliaspd.numpy: Use aliasnp.plotly.express: Use aliaspx.plotly.graph_objects: Use aliasgo.
# YOUR CODE BEGINS

# YOUR CODE ENDS
🧭 Check Your Work
Run the code cell below to test your solution.
✔️ If the code cell runs without errors, you’re good to move on.
❌ If the code cell produces an error, review your code and fix any mistakes.
# DO NOT CHANGE THE CODE IN THIS CELL
_test_case = "part-01"
_points = 2
tc.assertTrue(
"pd" in globals(), "Check whether you have correctly imported Pandas with an alias."
)
tc.assertTrue(
"np" in globals(), "Check whether you have correctly imported NumPy with an alias."
)
print(f"The current plotly version is {plotly.__version__}")
plotly_major_version = int(plotly.__version__.split(".")[0])
tc.assertGreaterEqual(
plotly_major_version, 5, "Your plotly version should be greater than or equal to 5"
)
tc.assertIsNotNone(
go.Figure,
"Check whether you have correctly imported plotly.graph_objects with an alias go.",
)
tc.assertIsNotNone(
px.scatter,
"Check whether you have correctly imported plotly.express with an alias px.",
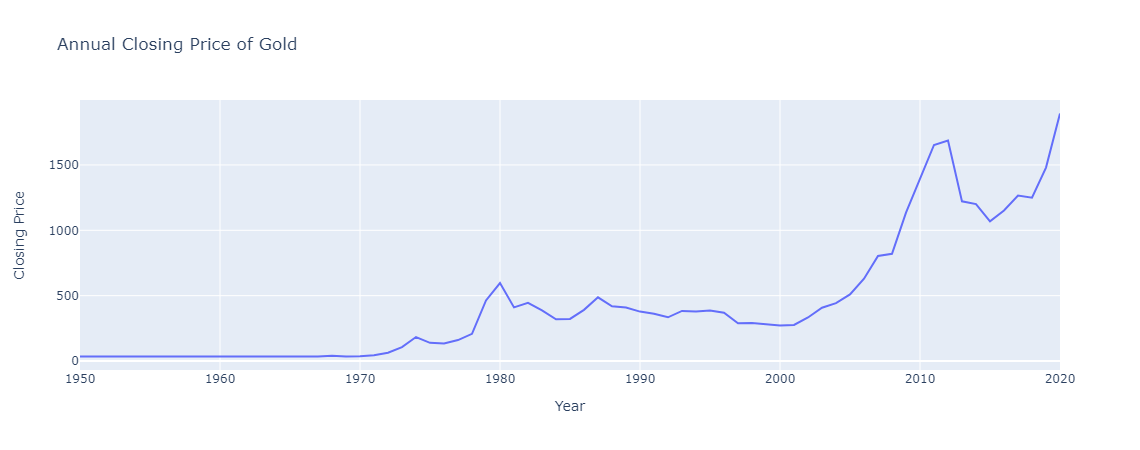
)🎯 Exercise 2: Annual closing gold price 📈
▶️ Run the code cell below to import annual gold closing prices dataset 💛.
# DO NOT CHANGE THE CODE BELOW
df_gold = pd.read_csv(
    "https://github.com/bdi475/datasets/raw/main/gold-annual-closing-price.csv"
)
df_gold_backup = df_gold.copy()
df_gold.head(5)
👇 Tasks
✔️ Using
df_gold, create a line chart that displays the closing price by year.✔️ Store your figure to a variable named
fig.✔️ Add an appropriate title to your figure.
✔️ Display the figure using
fig.show()
# YOUR CODE BEGINS

# YOUR CODE ENDS
🔑 Sample output
🧭 Check Your Work
Run the code cell below to test your solution.
✔️ If the code cell runs without errors, you’re good to move on.
❌ If the code cell produces an error, review your code and fix any mistakes.
_test_case = "part-02"
_points = 2
tc.assertEqual(len(fig.data), 1, "There must be only one plot in your figure")
tc.assertIsNotNone(fig.layout.title.text, "Missing figure title")
tc.assertEqual(fig.data[0].type, "scatter", "Must be a line chart")
tc.assertIsNotNone(fig.data[0].line.color, "Must be a line chart")
np.testing.assert_array_equal(fig.data[0].x, df_gold["Year"], "Incorrect x-axis data")
np.testing.assert_array_equal(
fig.data[0].y, df_gold["Closing Price"], "Incorrect y-axis data"
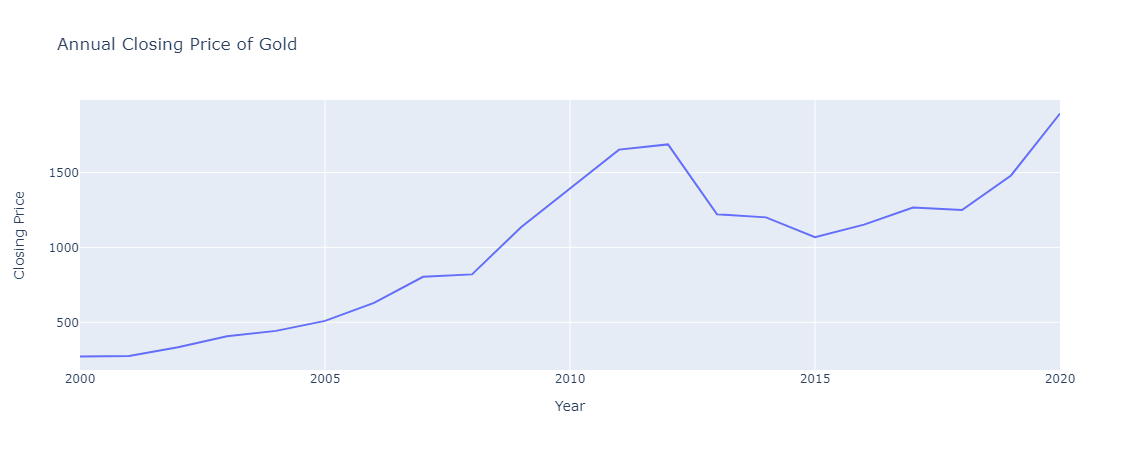
)🎯 Exercise 3: Annual closing gold price in 2000s 📈
👇 Tasks
✔️ Using
df_gold, create a line chart that displays the closing price by year.Only include years 2000 or later (
df_gold['Year'] >= 2000).
✔️ Store your figure to a variable named
fig.✔️ Add an appropriate title to your figure.
✔️ Display the figure using
fig.show()
🚀 Hints
👉
fig = px.line(df_gold[df_gold['Year'] >= 2000], x='Year', ...)
# YOUR CODE BEGINS

# YOUR CODE ENDS
🔑 Sample output
🧭 Check Your Work
Run the code cell below to test your solution.
✔️ If the code cell runs without errors, you’re good to move on.
❌ If the code cell produces an error, review your code and fix any mistakes.
_test_case = "part-03"
_points = 2

tc.assertEqual(len(fig.data), 1, "There must be only one plot in your figure")
tc.assertIsNotNone(fig.layout.title.text, "Missing figure title")
tc.assertEqual(fig.data[0].type, "scatter", "Must be a line chart")
tc.assertIsNotNone(fig.data[0].line.color, "Must be a line chart")
np.testing.assert_array_equal(
    fig.data[0].x,
    df_gold_backup.query(base64.b64decode(b"WWVhciA+PSAyMDAw").decode())["Year"],
    "Incorrect x-axis data",
)
np.testing.assert_array_equal(
    fig.data[0].y,
    df_gold_backup.query(base64.b64decode(b"WWVhciA+PSAyMDAw").decode())[
        "Closing Price"
    ],
    "Incorrect y-axis data",
)
📌 Import dataset

From this point on, you will work with bikesharing trips dataset 🚲. The original dataset has been retrieved from https://
▶️ Run the code below to import the dataset. This dataset is a fairly large with 200k rows, so it may take up to a few minutes.
# Display all columns
pd.set_option("display.max_columns", 50)
df_trips = pd.read_csv(
"https://github.com/bdi475/datasets/blob/main/bluebikes-trip-data-2020-sampled.csv.gz?raw=true",
compression="gzip",
parse_dates=["start_time", "stop_time"],
)
df_trips_backup = df_trips.copy()
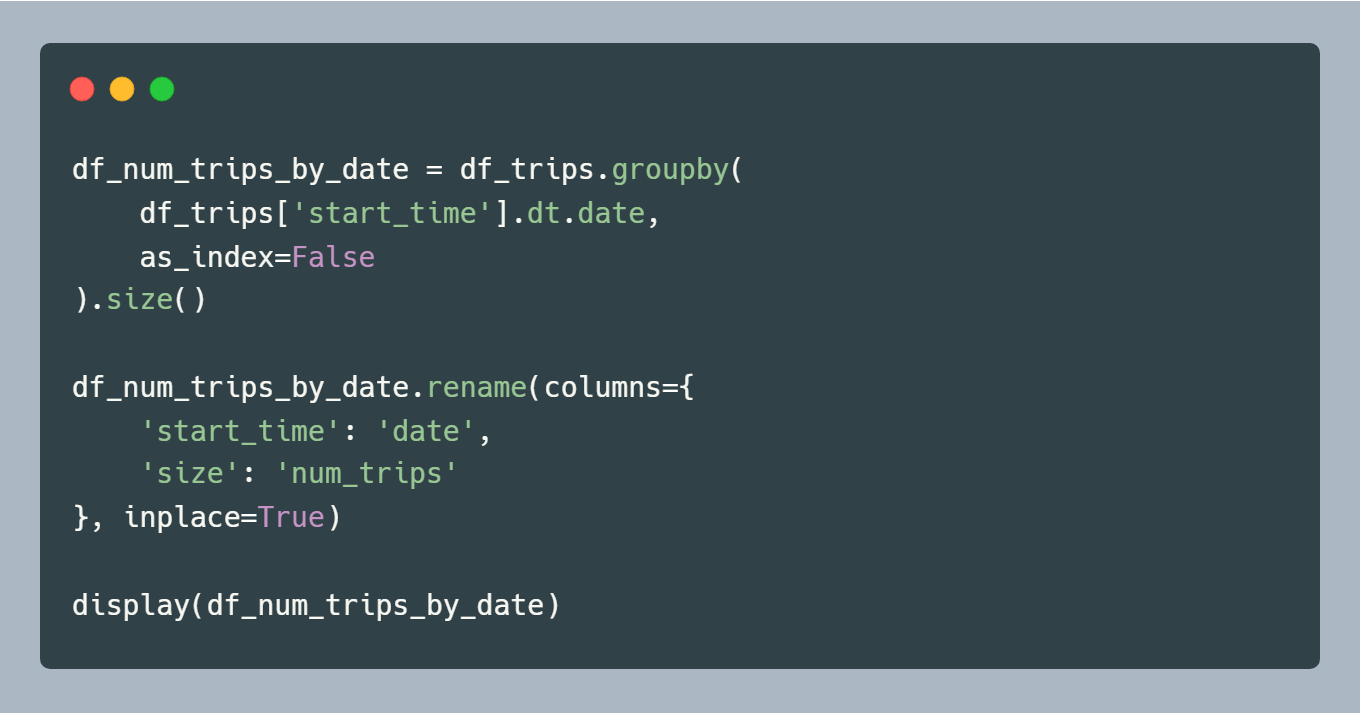
display(df_trips)🎯 Exercise 4: Create an aggregated DataFrame with number of trips by date
👇 Tasks
✔️ One of the common tasks when visualizing your data is to aggregate your data before plotting them.
✔️ Using
df_trips, create a new DataFrame nameddf_num_trips_by_datethat holds the number of trips by date.✔️ We will give you the fully working code below.
# YOUR CODE BEGINS

# YOUR CODE ENDS
🧭 Check Your Work
Run the code cell below to test your solution.
✔️ If the code cell runs without errors, you’re good to move on.
❌ If the code cell produces an error, review your code and fix any mistakes.
_test_case = "part-04"
_points = 2
df_check = (
df_trips_backup.groupby(df_trips_backup["start_time"].dt.date)
.size()
.reset_index()
.rename(columns={"start_time": "date", 0: "num_trips"})
)
pd.testing.assert_frame_equal(
df_num_trips_by_date.sort_values("date").reset_index(drop=True),
df_check.sort_values("date").reset_index(drop=True),
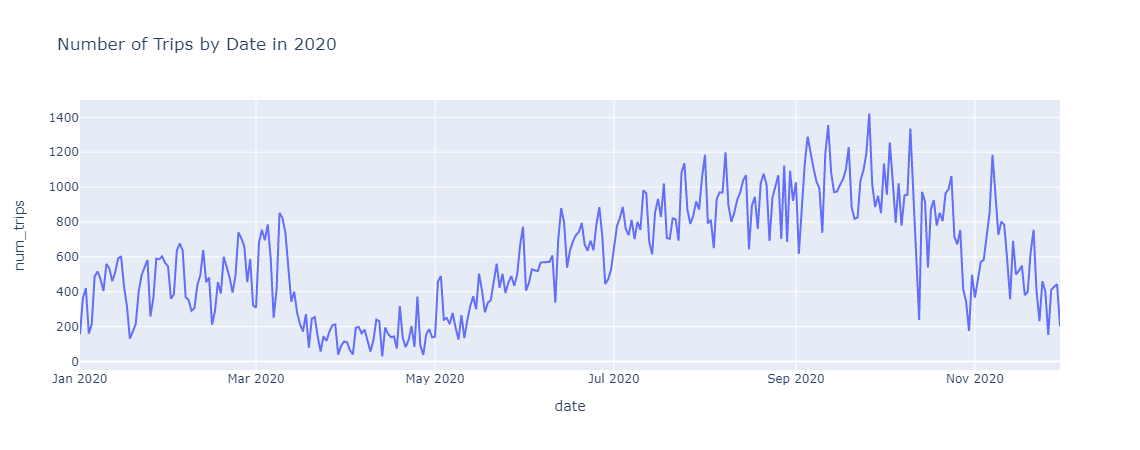
)🎯 Exercise 5: Number of trips by date (📈 Line Chart)
👇 Tasks
✔️ Using
df_num_trips_by_date, create a line chart that displays the number of trips by date.✔️ Store your figure to a variable named
fig.✔️ Add an appropriate title to your figure.
✔️ Display the figure using
fig.show()
# YOUR CODE BEGINS

# YOUR CODE ENDS
🔑 Sample output
🧭 Check Your Work
Run the code cell below to test your solution.
✔️ If the code cell runs without errors, you’re good to move on.
❌ If the code cell produces an error, review your code and fix any mistakes.
_test_case = "part-05"
_points = 2
tc.assertEqual(len(fig.data), 1, "There must be only one plot in your figure")
tc.assertIsNotNone(fig.layout.title.text, "Missing figure title")
tc.assertEqual(fig.data[0].type, "scatter", "Must be a line chart")
tc.assertIsNotNone(fig.data[0].line.color, "Must be a line chart")
np.testing.assert_array_equal(
fig.data[0].x, df_num_trips_by_date["date"], "Incorrect x-axis data"
)
np.testing.assert_array_equal(
fig.data[0].y, df_num_trips_by_date["num_trips"], "Incorrect y-axis data"
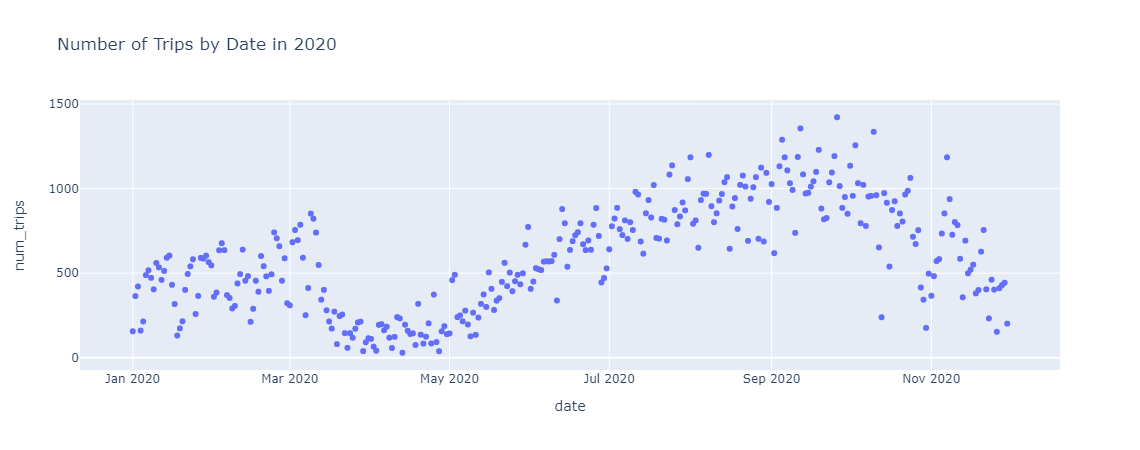
)🎯 Exercise 6: Number of trips by date (Scatter Plot)
👇 Tasks
✔️ Using
df_num_trips_by_date, create a scatter plot that displays the number of trips by date.✔️ Store your figure to a variable named
fig.✔️ Add an appropriate title to your figure.
✔️ Display the figure using
fig.show()
# YOUR CODE BEGINS

# YOUR CODE ENDS
🔑 Sample output
🧭 Check Your Work
Run the code cell below to test your solution.
✔️ If the code cell runs without errors, you’re good to move on.
❌ If the code cell produces an error, review your code and fix any mistakes.
_test_case = "part-06"
_points = 2

tc.assertEqual(len(fig.data), 1, "There must be only one plot in your figure")
tc.assertIsNotNone(fig.layout.title.text, "Missing figure title")
tc.assertEqual(fig.data[0].type, "scatter", "Must be a scatter plot")
tc.assertIsNone(fig.data[0].line.color, "Must be a scatter plot")
np.testing.assert_array_equal(
    fig.data[0].x, df_num_trips_by_date["date"], "Incorrect x-axis data"
)
np.testing.assert_array_equal(
    fig.data[0].y, df_num_trips_by_date["num_trips"], "Incorrect y-axis data"
)
🎯 Exercise 7: Number of trips by week of the year at the top 3 stations
▶️ Run the code below to find the top 3 stations (by start position).
top3_start_stations = df_trips["start_station_name"].value_counts().index[:3]
top3_start_stations
👇 Tasks
✔️ Using
df_tripsandtop3_start_stations, create a new DataFrame nameddf_num_trips_from_stationthat holds the number of trips by week of the year at the top 3 stations.✔️ We will give you the fully working code below.
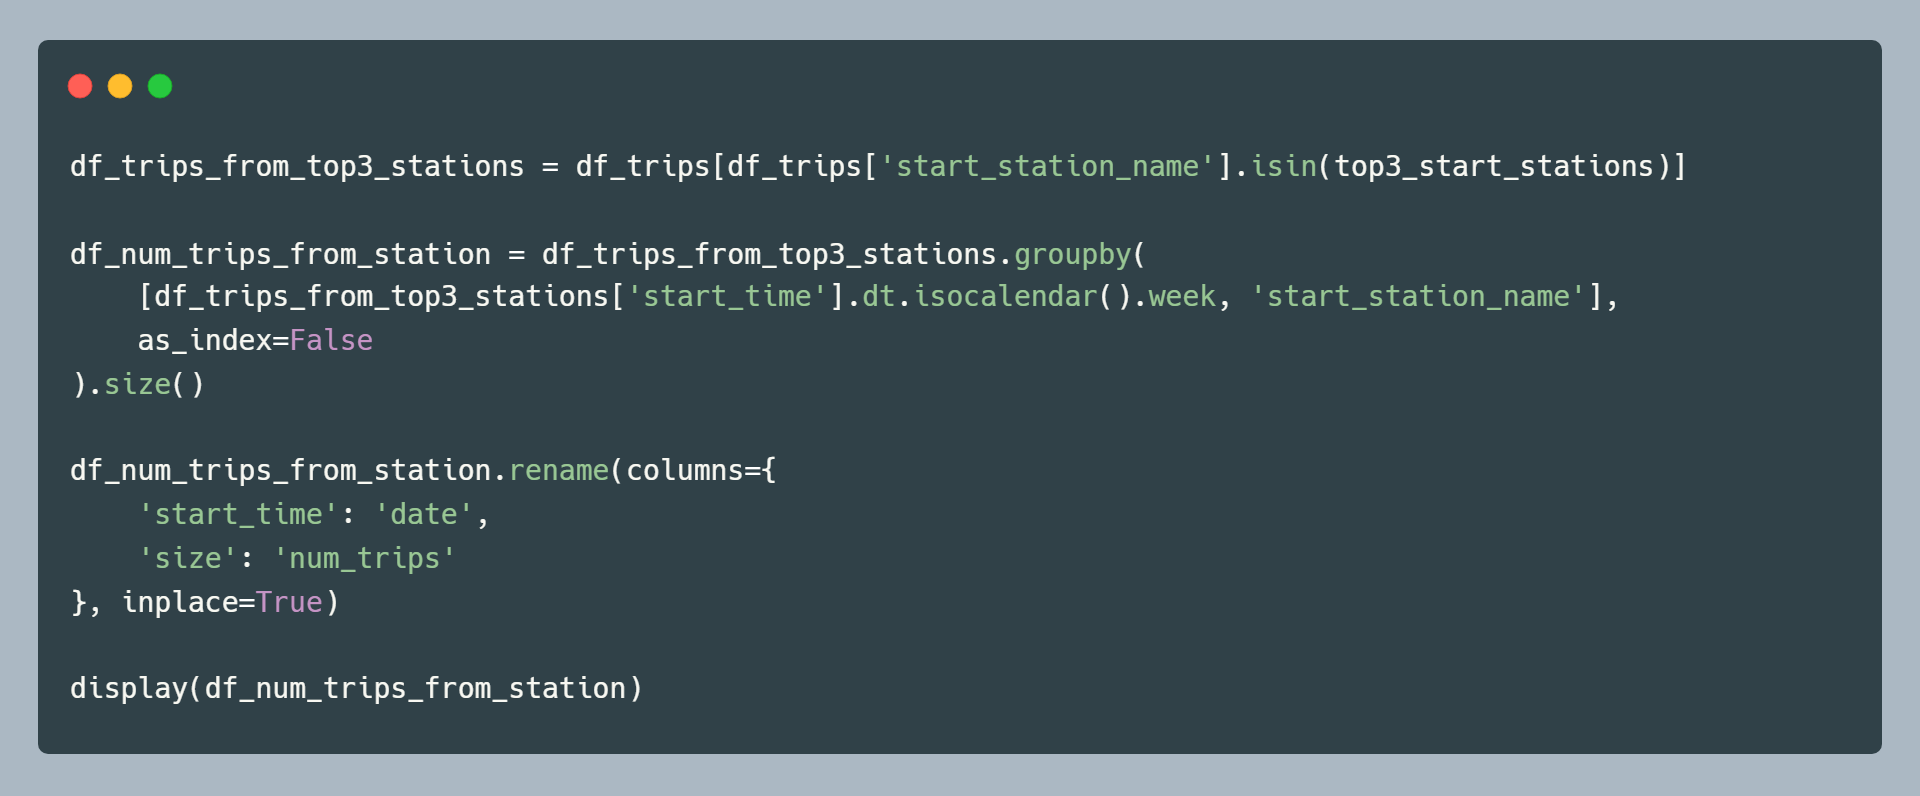
# YOUR CODE BEGINS

# YOUR CODE ENDS
🧭 Check Your Work
Run the code cell below to test your solution.
✔️ If the code cell runs without errors, you’re good to move on.
❌ If the code cell produces an error, review your code and fix any mistakes.
_test_case = "part-07"
_points = 2
df_t3 = df_trips_backup[
df_trips_backup["start_station_name"].isin(
df_trips_backup["start_station_name"].value_counts().index[:3]
)
]
df_check = (
df_t3.groupby([df_t3["start_time"].dt.isocalendar().week, "start_station_name"])
.size()
.reset_index()
.rename(columns={"start_time": "date", 0: "num_trips"})
)
pd.testing.assert_frame_equal(
df_num_trips_from_station.sort_values(["week", "start_station_name"]).reset_index(
drop=True
),
df_check.sort_values(["week", "start_station_name"]).reset_index(drop=True),
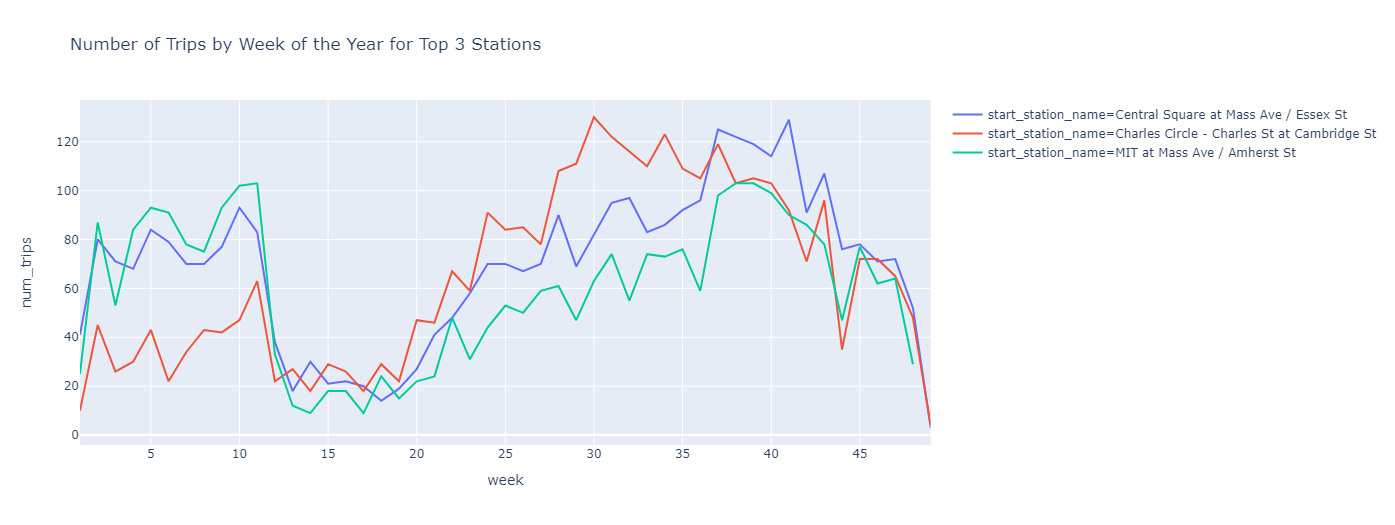
)🎯 Exercise 8: Number of trips by week of the year at the top 3 stations (Line Chart)
👇 Tasks
✔️ Using
df_num_trips_from_station, create a line chart that displays the number of trips by week.✔️ Draw three line charts on a single figure.
Use different colors to distinguish
start_station_name.
✔️ Store your figure to a variable named
fig.✔️ Add an appropriate title to your figure.
✔️ Display the figure using
fig.show()
# YOUR CODE BEGINS

# YOUR CODE ENDS
🔑 Sample output
🧭 Check Your Work
Run the code cell below to test your solution.
✔️ If the code cell runs without errors, you’re good to move on.
❌ If the code cell produces an error, review your code and fix any mistakes.
_test_case = "part-08"
_points = 2

tc.assertEqual(len(fig.data), 3, "There must be three plots in your figure")
tc.assertIsNotNone(fig.layout.title.text, "Missing figure title")

for i in range(3):
    tc.assertEqual(fig.data[i].type, "scatter", "Must be a line plot")
    tc.assertIsNotNone(fig.data[i].line.color, "Must be a line plot")

    np.testing.assert_array_equal(
        fig.data[i].x,
        df_num_trips_from_station[
            df_num_trips_from_station["start_station_name"]
            == df_num_trips_from_station["start_station_name"].unique()[i]
        ]["week"],
        "Incorrect x-axis data",
    )
    np.testing.assert_array_equal(
        fig.data[i].y,
        df_num_trips_from_station[
            df_num_trips_from_station["start_station_name"]
            == df_num_trips_from_station["start_station_name"].unique()[i]
        ]["num_trips"],
        "Incorrect y-axis data",
    )
🎯 Exercise 9: Create an aggregated DataFrame with number of trips by station
👇 Tasks
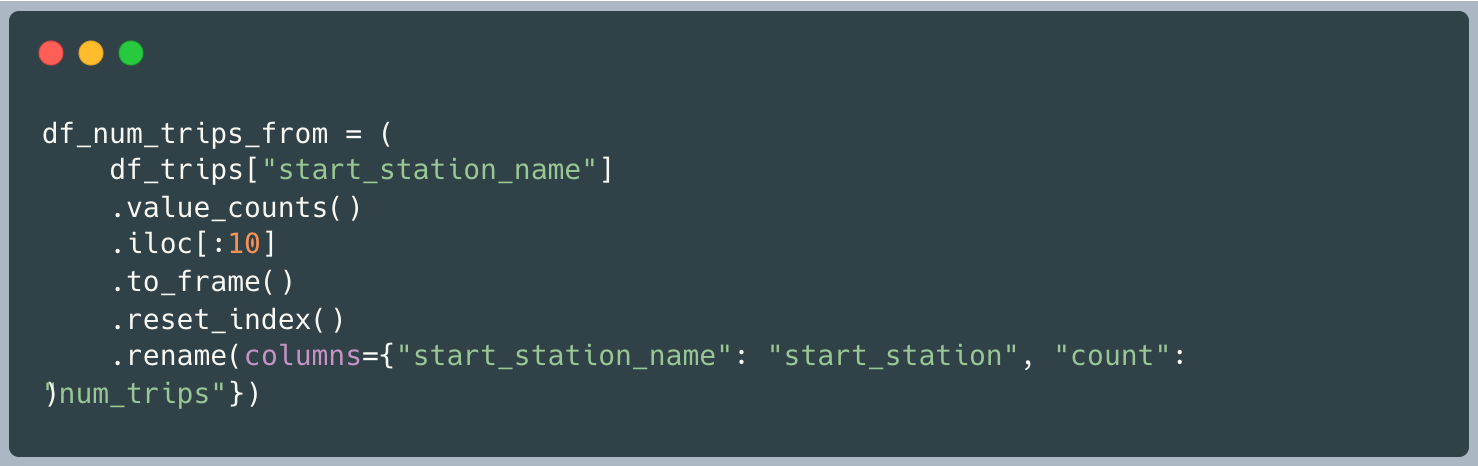
✔️ Using
df_trips, create a new DataFrame nameddf_num_trips_by_monththat holds the number of trips by start station names.✔️ Only select the top 10 stations (by number of trips).
✔️ We will give you the fully working code below.
# YOUR CODE BEGINS

# YOUR CODE ENDS
🧭 Check Your Work
Run the code cell below to test your solution.
✔️ If the code cell runs without errors, you’re good to move on.
❌ If the code cell produces an error, review your code and fix any mistakes.
_test_case = "part-09"
_points = 2
df_check = (
df_trips_backup.groupby("start_station_name")
.size()
.sort_values(ascending=False)
.iloc[:10]
.reset_index()
.rename(columns={"start_station_name": "start_station", 0: "num_trips"})
)
pd.testing.assert_frame_equal(
df_num_trips_from.reset_index(drop=True), df_check.reset_index(drop=True)
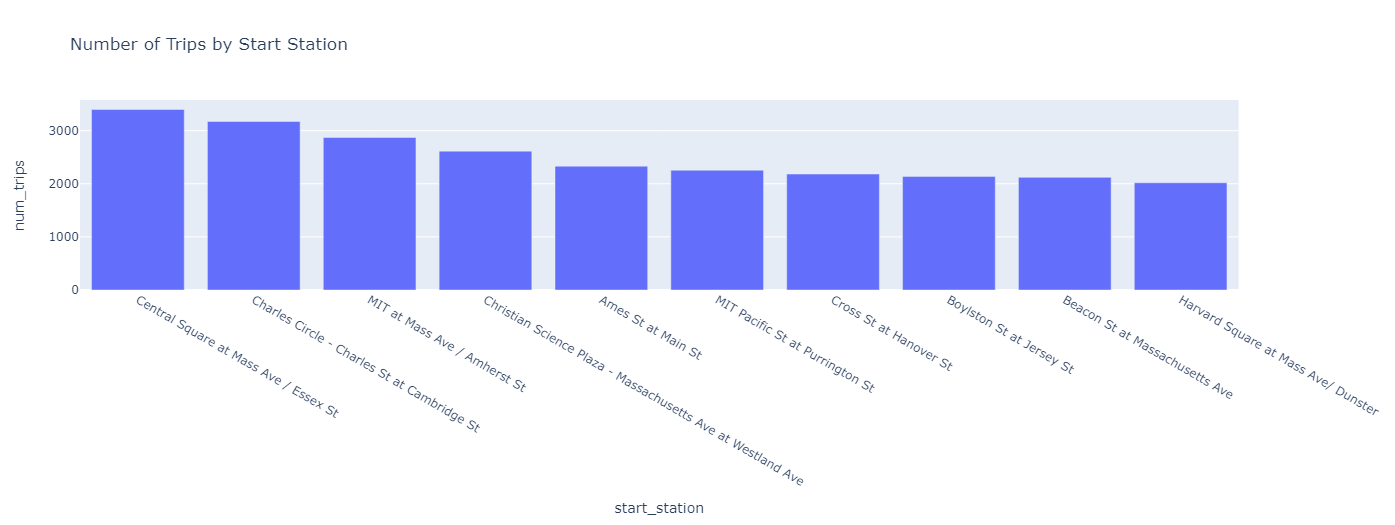
)🎯 Exercise 10: Number of trips by station (Bar Chart)
👇 Tasks
✔️ Using
df_num_trips_from, create a bar chart that displays the number of trips by station.✔️ Store your figure to a variable named
fig.✔️ Add an appropriate title to your figure.
✔️ Display the figure using
fig.show()
# YOUR CODE BEGINS

# YOUR CODE ENDS
🔑 Sample output
🧭 Check Your Work
Run the code cell below to test your solution.
✔️ If the code cell runs without errors, you’re good to move on.
❌ If the code cell produces an error, review your code and fix any mistakes.
_test_case = "part-10"
_points = 2

tc.assertEqual(len(fig.data), 1, "There must be only one plot in your figure")
tc.assertIsNotNone(fig.layout.title.text, "Missing figure title")
tc.assertEqual(fig.data[0].type, "bar", "Must be a bar chart")
tc.assertEqual(
    fig.data[0].orientation, "v", "Your plot should have a vertical orientation"
)
np.testing.assert_array_equal(
    fig.data[0].x, df_num_trips_from["start_station"], "Incorrect x-axis data"
)
np.testing.assert_array_equal(
    fig.data[0].y, df_num_trips_from["num_trips"], "Incorrect y-axis data"
)