▶️ Import pandas and numpy.
import pandas as pd
import numpy as np
▶️ Create a DataFrame named df_emp with the following data:
df_emp = pd.DataFrame(
    {
        "emp_id": [30, 40, 10, 20],
        "name": ["Colby", "Adam", "Eli", "Dylan"],
        "dept": ["Sales", "Marketing", "Sales", "Marketing"],
        "office_phone": ["(217)123-4500", np.nan, np.nan, "(217)987-6543"],
        "start_date": ["2017-05-01", "2018-02-01", "2020-08-01", "2019-12-01"],
        "salary": [202000, 185000, 240000, 160500],
    }
)

# Used for intermediate checks
df_emp_backup = df_emp.copy()

df_emp🧮 NumPy and Pandas Data Types
Pandas is built on top of NumPy, a powerful library for numerical computing in Python. As a result, many of the data types in Pandas are derived from NumPy’s ndarray and its data types (dtypes). This means that you can expect similar behavior and performance characteristics when working with data in Pandas.
🔮 NumPy Data Types
Here are some of the most commonly used data types in NumPy:
🔢 Numeric Types
Signed integers:
int8,int16,int32,int64Unsigned integers:
uint8,uint16,uint32,uint64Floating point:
float16,float32,float64, etc.
🚦 Boolean type
Boolean:
bool_
📝 String (Text)
Fixed-length Unicode (string):
str_orU(e.g.,U20for 20-character string)Fixed-length bytes (string):
bytes_orS(e.g.,S10for 10-byte string)
📅 Datetime and Timedelta
Dates and times:
datetime64with various precisions ([Y, M, D, h, m, s, ms, us, ns])Time differences:
timedelta64
You can check the dtype of a NumPy array using the .dtype attribute:
import numpy as np

a = np.array([1, 2, 3], dtype=np.int16)
print(a.dtype)   # int16
You can check the data types of each column using the dtypes property.
🐼 Pandas Data Types
Pandas extend NumPy’s type systems. This means that you can use many of the same data types in Pandas that you would use in NumPy, and vice versa.
The main difference is that Pandas also provides some additional data types that are specific to Pandas.
Here are the most important additional dtypes pandas introduces:
📦
objectdtype (legacy, but important)A “catch-all” type for mixed or non-numeric data
Commonly used for strings in older pandas versions
Backed by generic Python objects
📝 StringDType (
string)Introduced to replace
objectfor textA dedicated string type introduced in pandas 1.0
More efficient and consistent than
objectfor text dataSupports missing values (NA) natively
codes = pd.Series(["ACCY", "FIN", "BDI", None], dtype="string")
🗂️ CategoricalDType (
category)For categorical data with a fixed number of possible values
More memory-efficient than using
objectorstringfor repeated valuesStores data as integer codes with a mapping to the actual categories
standing = pd.Series(["freshman", "sophomore", "junior", "senior"], dtype="category")
🚦 Nullable Boolean (
boolean)A boolean type that supports missing values (NA)
Different from the standard
booltype, which does not support NAis_enrolled = pd.Series([True, False, None, True], dtype="boolean")
🔢 Nullable Integer (
Int64,Int32, etc.)Integer types that support missing values (NA)
Different from standard NumPy integer types, which do not support NA
credits = pd.Series([84, 99, None, 120], dtype="Int64")
📅 Datetime with Timezone (
datetime64[ns, tz])Datetime type that includes timezone information
Useful for handling time series data across different time zones
enrollment_date = pd.Series(["2025-09-01", "2025-08-24", None, "2025-08-03"], dtype="datetime64[ns, US/Central]")
⏰ PeriodDType (
period)For representing time periods (e.g., months, quarters)
Useful for time series analysis
period = pd.Series(pd.period_range("2024-01", periods=4, freq="Q"))
Please refer to the relevant Pandas documentation page for the list of all extension types.
df_emp.dtypesemp_id int64
name object
dept object
office_phone object
start_date object
salary int64
dtype: objectTo retrieve the data type of a column (Series), access the dtype property.
str(df_emp["name"].dtype)'object'🧰 Pandas Column Operations
Pandas provides a wide range of operations for manipulating columns in a DataFrame. Here are some common column operations you can perform:
| Operation | Code Example | Description |
|---|---|---|
| Select single column | df["col1"] | Returns a Series for the column |
| Select multiple columns | df[["col1", "col2"]] | Returns a DataFrame with chosen columns |
| Rename columns | df.rename(columns={"old": "new"}) | Rename columns using a mapping dictionary |
| Drop columns | df.drop(columns=["col1", "col2"]) | Remove one or more columns from DataFrame |
| Add new column | df["total"] = df["price"] * df["qty"] | Create a new column from existing ones |
| Reorder columns | df = df[["col3", "col1", "col2"]] | Rearrange column order manually |
| Change dtype | df["age"] = df["age"].astype(int) | Convert a column’s data type |
| Rename all columns | df.columns = df.columns.str.upper() | Apply transformation to all column names |
| Select by index | df.iloc[:, [0, 2]] | Select columns by their position (1st & 3rd) |
🧲 Select Subset of Columns
You can select a subset of columns from a DataFrame using either the bracket notation df[] or the .loc[] accessor.
Selecting a single column returns a Series.
df_emp["name"]0 Colby
1 Adam
2 Eli
3 Dylan
Name: name, dtype: objectdf_emp.loc[:, "name"]0 Colby
1 Adam
2 Eli
3 Dylan
Name: name, dtype: objecttype(df_emp["name"])pandas.core.series.SeriesSelecting multiple columns returns a DataFrame.
df_emp[["name", "dept"]]df_emp.loc[:, ["name", "dept"]]type(df_emp[["name", "dept"]])pandas.core.frame.DataFrame🏷️ Rename Column(s)
You can rename columns using the rename() method. This method allows you to specify a mapping of old column names to new column names.
The rename() method does not modify the original DataFrame by default. Instead, it returns a new DataFrame with the updated column names. If you want to modify the original DataFrame in place, you can set the inplace parameter to True.
# Rename a column and return a new DataFrame without modifying the original
# df's column names will remain unchanged
df_renamed = df.rename(columns={"name_before": "name_after"})

# Rename a column and update the original DataFrame
df.rename(columns={"name_before": "name_after"}, inplace=True)🎯 Example: Rename "office_phone" column to "phone_num" (out-of-place)
df_renamed = df_emp.rename(columns={"office_phone": "phone_num"})

df_renamed🎯 Example: Rename "office_phone" column to "phone_num" (in-place)
# Create a copy of the original DataFrame for this demo
df_emp2 = df_emp.copy()

df_emp2.rename(columns={"office_phone": "phone_num"}, inplace=True)

df_emp2Compare the original df_emp and modified df_emp2 DataFrames to see the change.
# Use head(1) to only show the first row for brevity
display(df_emp.head(1))
display(df_emp2.head(1))You can see that the "office_phone" column has been renamed to "phone_num" in df_emp2, while df_emp remains unchanged.
🎯 Example: Rename "name" to "first_name" and "salary" to "base_salary" (in-place)
You can rename multiple columns at once by providing a dictionary with multiple key-value pairs to the columns parameter of the rename() method.
df_emp3 = df_emp.copy()

df_emp3.rename(columns={"name": "first_name", "salary": "base_salary"}, inplace=True)

df_emp3🗑️ Drop Column(s)
You can rename a column using df.drop(columns=["col1", "col2"]). Similar to rename(), the drop() method does not modify the original DataFrame by default. Instead, it returns a new DataFrame with the specified columns removed. If you want to modify the original DataFrame in place, you can set the inplace parameter to True.
# Copy df, drop columns
# df will remain unchaged
df_dropped = df.drop(columns=["col1", "col2"])

# Drop columns in place, modifying the original df
df.drop(columns=["col1", "col2"], inplace=True)
🎯 Example: Drop start_date column (out-of-place)
df_dropped = df_emp.drop(columns=["start_date"])

df_dropped🎯 Example: Drop "name" and "salary" columns in-place
# Create a copy of the original DataFrame to preserve the original DataFrame
df_emp4 = df_emp.copy()

df_emp4.drop(columns=["name", "salary"], inplace=True)

df_emp4🕳️ Working with Missing Values
In real-world datasets, it’s common to encounter missing or null values. These missing values can arise for various reasons, such as unknown values, data entry errors, incomplete data collection, or intentional omissions. Handling missing values is a crucial step in data preprocessing, as they can significantly impact the results of your analysis or machine learning models.
🧩 Missing Value Markers in Pandas
While Python has its own built-in None type to represent missing values, Pandas provides a more comprehensive approach to handling missing data. Pandas recognizes several markers for missing values, allowing for greater flexibility in data representation.
🧪 np.nan (Not a Number) - Most Common Marker
The most common marker for missing values in Pandas is NumPy’s np.nan (NaN), which stands for “Not a Number”. It is a special floating-point value defined by the IEEE 754 standard. The NaN value represents missing or undefined numerical data.
Note that NaN is a float, so if a column contains any NaN values, Pandas will automatically convert the entire column to a floating-point type to accommodate the NaN unless you use one of the nullable types.
🐼 pd.NA (Pandas NA)
Pandas introduced a new scalar value pd.NA in version 1.0 to represent missing values in a more consistent way across different data types. pd.NA is part of Pandas’ nullable data types, which allow for missing values in integer, boolean, and string columns without converting them to floating-point types.
⏳ pd.NaT (Not a Time)
For datetime-like data, Pandas uses pd.NaT to represent missing or null date and time values. NaT is similar to NaN but specifically designed for datetime objects.
🔍 Methods to Detect Missing Values
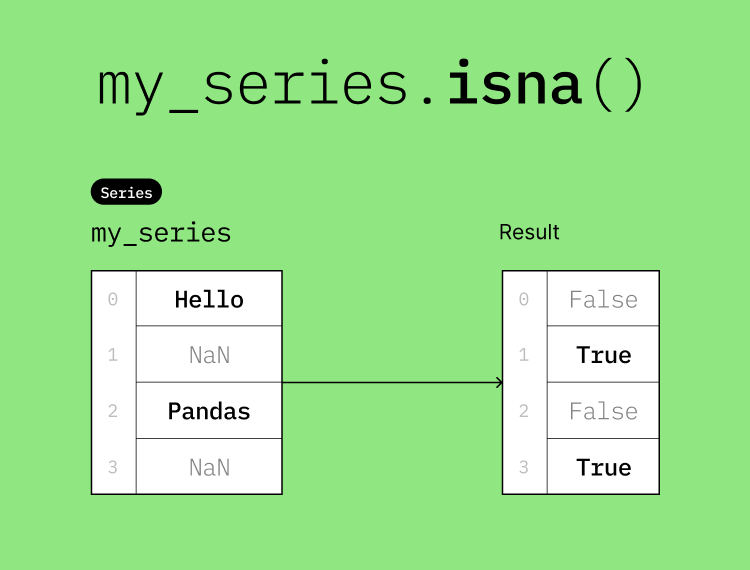
You can use the isna() or isnull() methods to detect missing values in a DataFrame. Both methods are equivalent and return a DataFrame of the same shape as the original, with True for missing values and False for non-missing values.
# Detect missing values in the entire DataFrame
df["my_column"].isna() # or df["my_column"].isnull()
Recall that a column in a DataFrame is a Series, so you can test the isna() method on a Series.
my_series = pd.Series(["Hello", np.nan, "Pandas", pd.NA])
my_series.isna()
0 False
1 True
2 False
3 True
dtype: boolHere is a visual representation of the isna() method:
🎯 Example: Find employees without a phone number
First, create a boolean mask that identifies rows where the "office_phone" column is NaN using the isna() method. Then, use this mask to filter the DataFrame and display only the rows with missing phone numbers.
mask = df_emp["office_phone"].isna()
mask
0 False
1 True
2 True
3 False
Name: office_phone, dtype: boolUse the boolean mask to filter the DataFrame and display rows with missing phone numbers.
df_emp[mask]
# This can be done in one line as well: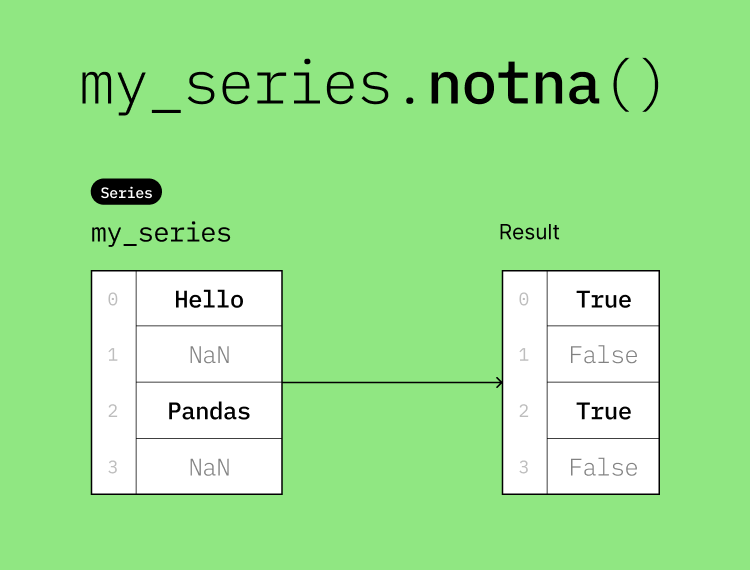
# df_emp[df_emp["office_phone"].isna()]If you want to detect non-missing values, you can use the notna() or notnull() methods.
# Detect non-missing values in the entire DataFrame
df["my_column"].notna() # or df["my_column"].notnull()
my_series = pd.Series(["Hello", np.nan, "Pandas", pd.NA])
my_series.notna()0 True
1 False
2 True
3 False
dtype: boolHere is a visual representation of the notna() method:
🎯 Example: Find employees with a phone number
First Method: Using dropna()
The dropna() method removes rows or columns with missing values. By default, it removes any row that contains at least one NaN value. You can specify the axis parameter to control whether to drop rows (axis=0) or columns (axis=1). You can also use the how parameter to specify whether to drop rows/columns that contain any (how='any') or all (how='all') missing values.
Because we’re only interested in rows with missing values in the "office_phone" column, we can specify the subset parameter to limit the operation to that column.
df_emp.dropna(subset=["office_phone"])Second Method: Using Boolean Indexing
Create a boolean mask that identifies rows where the "office_phone" column is not NaN using the notna() method. Then, use this mask to filter the DataFrame and display only the rows with non-missing phone numbers.
mask = df_emp["office_phone"].notna()
mask
0 True
1 False
2 False
3 True
Name: office_phone, dtype: boolUse the boolean mask to filter the DataFrame and display rows with phone numbers.
df_emp[mask]
# This can be done in one line as well:
# df_emp[df_emp["office_phone"].notna()]