🏆 20 points available
▶️ Run the code cell below to import unittest, a module used for 🧭 Check Your Work sections and the autograder.
import unittest
import base64
import plotly

tc = unittest.TestCase()
🎯 Exercise 1: Import Packages
👇 Tasks
✔️ Import the following Python packages.
pandas: Use aliaspd.numpy: Use aliasnp.plotly.express: Use aliaspx.plotly.graph_objects: Use aliasgo.
# YOUR CODE BEGINS

# YOUR CODE ENDS
🧭 Check Your Work
Run the code cell below to test your solution.
✔️ If the code cell runs without errors, you’re good to move on.
❌ If the code cell produces an error, review your code and fix any mistakes.
# DO NOT CHANGE THE CODE IN THIS CELL
_test_case = "part-01"
_points = 2

tc.assertTrue(
    "pd" in globals(), "Check whether you have correctly imported Pandas with an alias."
)
tc.assertTrue(
    "np" in globals(), "Check whether you have correctly imported NumPy with an alias."
)

print(f"The current plotly version is {plotly.__version__}")
plotly_major_version = int(plotly.__version__.split(".")[0])
tc.assertGreaterEqual(
    plotly_major_version, 5, "Your plotly version should be greater than or equal to 5"
)

tc.assertIsNotNone(
    go.Figure,
    "Check whether you have correctly imported plotly.graph_objects with an alias go.",
)
tc.assertIsNotNone(
    px.scatter,
    "Check whether you have correctly imported plotly.express with an alias px.",
)
📌 Import dataset
Today, we work with a list of used cars information. The data has been downloaded from https://
▶️ Run the code below to import an cars Dataset. 🚗🚓🚕🛺🚙
# Display all columns
pd.set_option("display.max_columns", 50)

df_cars = pd.read_csv(
    "https://github.com/bdi475/datasets/raw/main/car-dekho-used-cars.csv"
)

display(df_cars)
🎯 Exercise 2: Number of rows and columns
👇 Tasks
✔️ Retrieve the number of rows in
df_carsto a new variable namednum_rows.✔️ Retrieve the number of columns in
df_carsto a new variable namednum_cols.✔️ Both
num_rowsandnum_colsshould be integer types.
🚀 Hints
my_dataframe.shapereturns a tuple containing the number of rows and columns ofmy_dataframe.You can retrieve the first element of a tuple using square brackets notation.
Example:
my_dataframe.shape[0]
# YOUR CODE BEGINS

# YOUR CODE ENDS

print(f"df_cars contains {num_rows} rows and {num_cols} columns.")
🧭 Check Your Work
Run the code cell below to test your solution.
✔️ If the code cell runs without errors, you’re good to move on.
❌ If the code cell produces an error, review your code and fix any mistakes.
_test_case = "part-02"
_points = 2
tc.assertEqual(
num_rows, len(df_cars.index), f"Number of rows should be {len(df_cars.index)}"
)
tc.assertEqual(
num_cols,
len(df_cars.columns),
f"Number of columns should be {len(df_cars.columns)}",
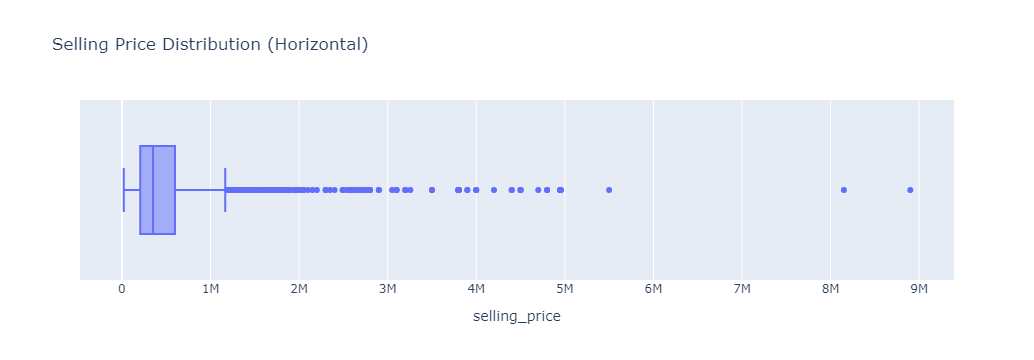
)🎯 Exercise 3: Selling price box plot (horizontal)
👇 Tasks
✔️ Draw a horizontal box plot of
selling_price.✔️ Store your figure to a variable named
fig.✔️ Add an appropriate title to your figure.
A title should describe your plot (e.g., Salary Box Plot).
✔️ Display the figure using
fig.show()
# YOUR CODE BEGINS

# YOUR CODE ENDS
🔑 Sample output
🧭 Check Your Work
Run the code cell below to test your solution.
✔️ If the code cell runs without errors, you’re good to move on.
❌ If the code cell produces an error, review your code and fix any mistakes.
_test_case = "part-03"
_points = 2
tc.assertEqual(len(fig.data), 1, "There must be only one plot in your figure")
tc.assertIsNotNone(fig.layout.title.text, "Missing figure title")
tc.assertEqual(fig.data[0].type, "box", "Not a box plot")
tc.assertEqual(
fig.data[0].orientation, "h", "Your plot should have a horizontal orientation"
)
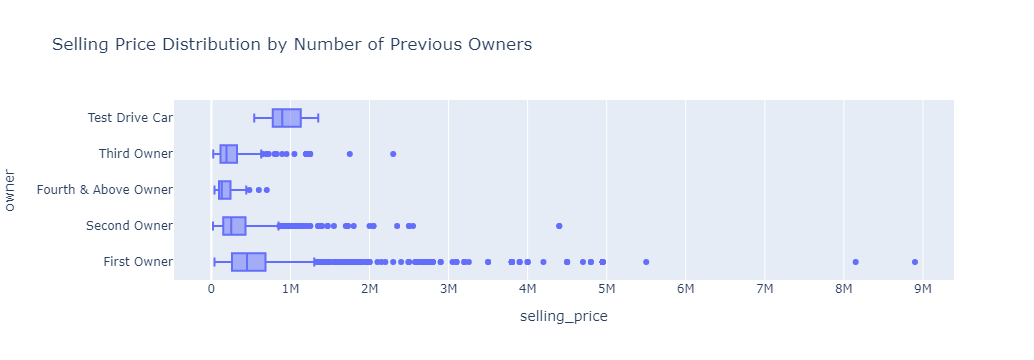
np.testing.assert_array_equal(fig.data[0].x, df_cars["selling_price"], "Incorrect data")🎯 Exercise 4: Selling price distribution by number of previous owners
👇 Tasks
✔️ Draw horizontal box plots of
selling_pricebyowner.✔️ Store your figure to a variable named
fig.✔️ Add an appropriate title to your figure.
✔️ Display the figure using
fig.show()
# YOUR CODE BEGINS

# YOUR CODE ENDS
🔑 Sample output
🧭 Check Your Work
Run the code cell below to test your solution.
✔️ If the code cell runs without errors, you’re good to move on.
❌ If the code cell produces an error, review your code and fix any mistakes.
_test_case = "part-04"
_points = 2
tc.assertEqual(len(fig.data), 1, "There must be only one plot in your figure")
tc.assertIsNotNone(fig.layout.title.text, "Missing figure title")
tc.assertEqual(fig.data[0].type, "box", "Not a box plot")
tc.assertEqual(
fig.data[0].orientation, "h", "Your plot should have a horizontal orientation"
)
np.testing.assert_array_equal(
fig.data[0].x, df_cars["selling_price"], "Incorrect x-axis data"
)
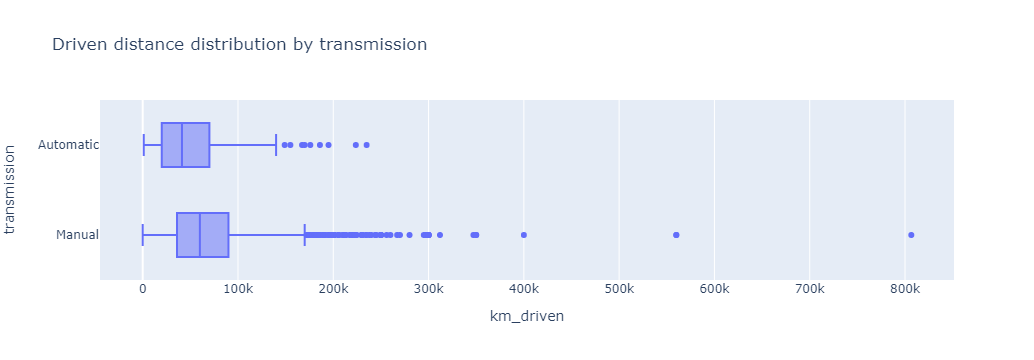
np.testing.assert_array_equal(fig.data[0].y, df_cars["owner"], "Incorrect y-axis data")🎯 Exercise 5: Driven distance distribution by transmission
👇 Tasks
✔️ Draw horizontal box plots of
km_drivenbytransmission.✔️ Store your figure to a variable named
fig.✔️ Add an appropriate title to your figure.
✔️ Display the figure using
fig.show()
# YOUR CODE BEGINS

# YOUR CODE ENDS
🔑 Sample output
🧭 Check Your Work
Run the code cell below to test your solution.
✔️ If the code cell runs without errors, you’re good to move on.
❌ If the code cell produces an error, review your code and fix any mistakes.
_test_case = "part-05"
_points = 2
tc.assertEqual(len(fig.data), 1, "There must be only one plot in your figure")
tc.assertIsNotNone(fig.layout.title.text, "Missing figure title")
tc.assertEqual(fig.data[0].type, "box", "Not a box plot")
tc.assertEqual(
fig.data[0].orientation, "h", "Your plot should have a horizontal orientation"
)
np.testing.assert_array_equal(
fig.data[0].x, df_cars["km_driven"], "Incorrect x-axis data"
)
np.testing.assert_array_equal(
fig.data[0].y, df_cars["transmission"], "Incorrect y-axis data"
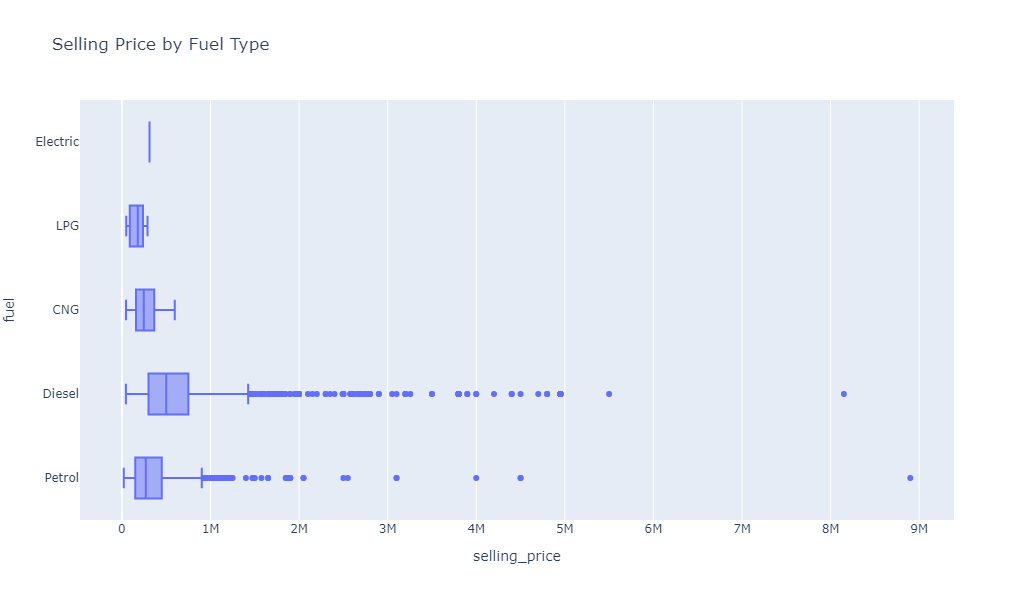
)🎯 Exercise 6: Selling price distribution by fuel type
👇 Tasks
✔️ Draw horizontal box plots of
selling_pricebyfuel.✔️ Store your figure to a variable named
fig.✔️ Add an appropriate title to your figure.
✔️ Set the height of your figure to
600.✔️ Display the figure using
fig.show()
🚀 Hints
fig = px.box(
    my_dataframe,
    x='my_column1',
    y='my_column2',
    title='Plot Title Goes Here',
    height=600
)
fig.show()
# YOUR CODE BEGINS
# YOUR CODE ENDS🔑 Sample output
🧭 Check Your Work
Run the code cell below to test your solution.
✔️ If the code cell runs without errors, you’re good to move on.
❌ If the code cell produces an error, review your code and fix any mistakes.
_test_case = "part-06"
_points = 3
tc.assertEqual(len(fig.data), 1, "There must be only one plot in your figure")
tc.assertIsNotNone(fig.layout.title.text, "Missing figure title")
tc.assertEqual(fig.data[0].type, "box", "Not a box plot")
tc.assertEqual(
fig.data[0].orientation, "h", "Your plot should have a horizontal orientation"
)
tc.assertEqual(fig.layout.height, 600, "Incorrect height")
np.testing.assert_array_equal(
fig.data[0].x, df_cars["selling_price"], "Incorrect x-axis data"
)
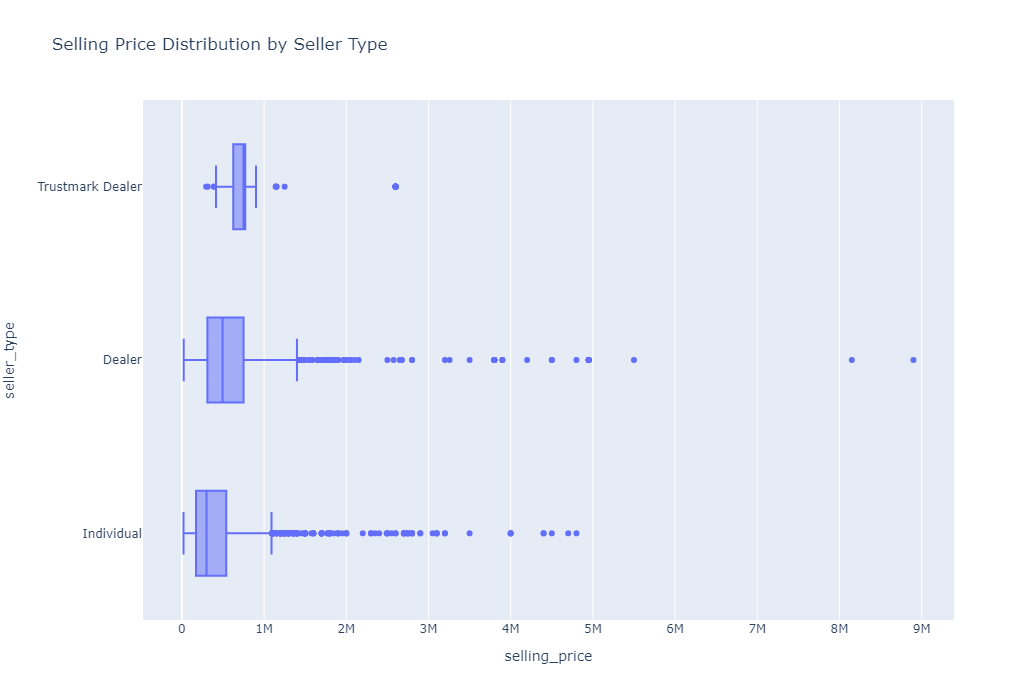
np.testing.assert_array_equal(fig.data[0].y, df_cars["fuel"], "Incorrect y-axis data")🎯 Exercise 7: Selling price distribution by seller type
👇 Tasks
✔️ Draw horizontal box plots of
selling_pricebyseller_type.✔️ Store your figure to a variable named
fig.✔️ Add an appropriate title to your figure.
✔️ Set the height of your figure to
700.✔️ Display the figure using
fig.show()
# YOUR CODE BEGINS

# YOUR CODE ENDS
🔑 Sample output
🧭 Check Your Work
Run the code cell below to test your solution.
✔️ If the code cell runs without errors, you’re good to move on.
❌ If the code cell produces an error, review your code and fix any mistakes.
_test_case = "part-07"
_points = 3
tc.assertEqual(len(fig.data), 1, "There must be only one plot in your figure")
tc.assertIsNotNone(fig.layout.title.text, "Missing figure title")
tc.assertEqual(fig.data[0].type, "box", "Not a box plot")
tc.assertEqual(
fig.data[0].orientation, "h", "Your plot should have a horizontal orientation"
)
tc.assertEqual(fig.layout.height, 700, "Incorrect height")
np.testing.assert_array_equal(
fig.data[0].x, df_cars["selling_price"], "Incorrect x-axis data"
)
np.testing.assert_array_equal(
fig.data[0].y, df_cars["seller_type"], "Incorrect y-axis data"
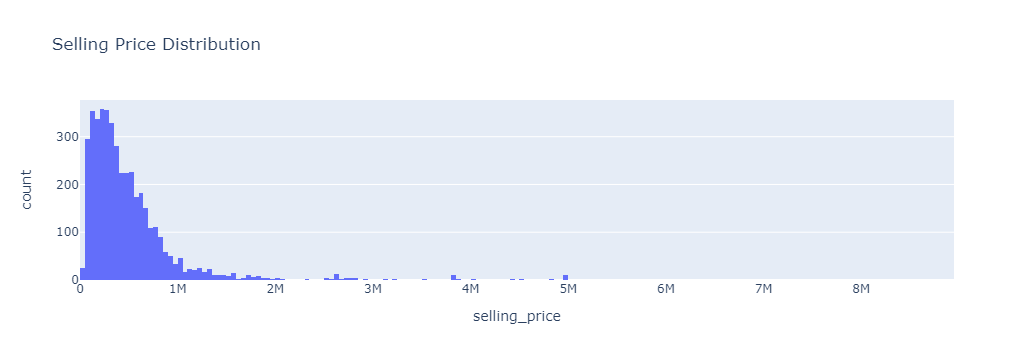
)🎯 Exercise 8: Selling price histogram
👇 Tasks
✔️ Draw a histogram (vertical) of
selling_priceindf_cars.✔️ Store your figure to a variable named
fig.✔️ Add an appropriate title to your figure.
✔️ Display the figure using
fig.show()
# YOUR CODE BEGINS

# YOUR CODE ENDS
🔑 Sample output
🧭 Check Your Work
Run the code cell below to test your solution.
✔️ If the code cell runs without errors, you’re good to move on.
❌ If the code cell produces an error, review your code and fix any mistakes.
_test_case = "part-08"
_points = 2
tc.assertEqual(len(fig.data), 1, "There must be only one plot in your figure")
tc.assertIsNotNone(fig.layout.title.text, "Missing figure title")
tc.assertEqual(fig.data[0].type, "histogram", "Not a histogram")
tc.assertEqual(
fig.data[0].orientation, "v", "Your plot should have a vertical orientation"
)
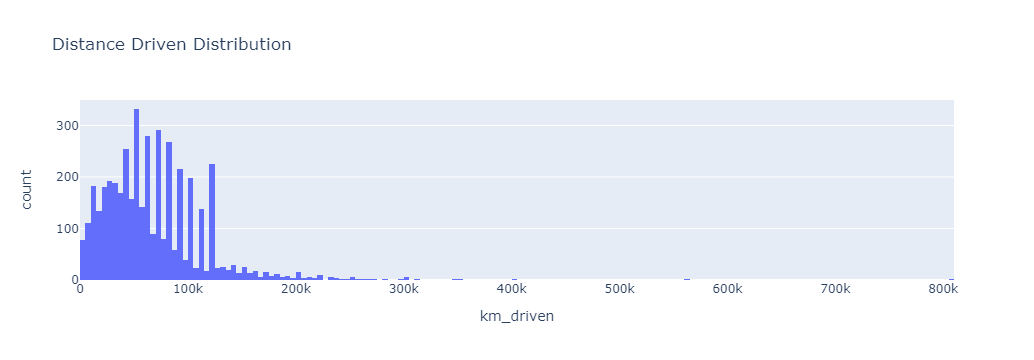
np.testing.assert_array_equal(fig.data[0].x, df_cars["selling_price"], "Incorrect data")🎯 Exercise 9: Distance driven distribution
👇 Tasks
✔️ Draw a histogram (vertical) of
km_drivenindf_cars.✔️ Store your figure to a variable named
fig.✔️ Add an appropriate title to your figure.
✔️ Display the figure using
fig.show()
# YOUR CODE BEGINS

# YOUR CODE ENDS
🔑 Sample output
🧭 Check Your Work
Run the code cell below to test your solution.
✔️ If the code cell runs without errors, you’re good to move on.
❌ If the code cell produces an error, review your code and fix any mistakes.
_test_case = "part-09"
_points = 2

tc.assertEqual(len(fig.data), 1, "There must be only one plot in your figure")
tc.assertIsNotNone(fig.layout.title.text, "Missing figure title")
tc.assertEqual(fig.data[0].type, "histogram", "Not a histogram")
tc.assertEqual(
    fig.data[0].orientation, "v", "Your plot should have a vertical orientation"
)
np.testing.assert_array_equal(fig.data[0].x, df_cars["km_driven"], "Incorrect data")