🏆 80 points available
🤠 Author: Park (ypark32@illinois
.edu) ✏️ Last updated on 3/24/2025
💎 Case Overview
You have been hired by Starbucks as a business analyst to identify which types of loyalty offers have been successful in the past. Before diving into loyalty offers, you first want to understand customer behaviors by demographics (gender, age, and income) without taking loyalty offers into account.

The dataset was originally provided to Udacity by Starbucks as part of a Data Science nanodegree. Three datasets were provided.
Transcript: A list of all purchases (transactions) and events related to loyalty offers
Profile: Demographic data for each customer in the Rewards app; customers who have not provided their demographic information will show up as
np.nanPortfolio: Offer information
For this case study, we will only use the first two datasets.
⚔️ Your Goal
Below are some of the questions you want to answer.
How many purchases were made through the Rewards app?
What were the mean, median, and maximum transaction amounts?
How many customers have not provided their demographic information?
On average, which gender makes the largest purchases? Which gender is most likely to spend the least amount?
Is there a correlation between age groups and customer behavior?
How about income groups?
Which gender/age groups are more “lucrative” compared to others?
▶️ First, run the code cell below to import unittest, a module used for 🧭 Check Your Work sections.
# DO NOT MODIFY THE CODE IN THIS CELL
import unittest
tc = unittest.TestCase()
🎯 Part 1: Import Pandas and NumPy
👇 Tasks
✔️ Import the following Python packages.
pandas: Use aliaspd.numpy: Use aliasnp.
# YOUR CODE BEGINS

# YOUR CODE ENDS
🧭 Check Your Work
Run the code cell below to test your solution.
✔️ If the code cell runs without errors, you’re good to move on.
❌ If the code cell produces an error, review your code and fix any mistakes.
# DO NOT CHANGE THE CODE IN THIS CELL
_test_case = 'part-01'
_points = 2

tc.assertTrue('pd' in globals(), 'Check whether you have correctly import Pandas with an alias.')
tc.assertTrue('np' in globals(), 'Check whether you have correctly import NumPy with an alias.')

# prevent user mixing up pandas and numpy
tc.assertTrue(hasattr(pd, 'DataFrame'))
tc.assertTrue(hasattr(np, 'ufunc'))
📌 Load Data
Throughout this problem set, you’ll work with the Starbucks Customer Rewards Program dataset. ☕ The dataset was originally released as a part of a capstone project for a Udacity course.
For this course, the original dataset in JSON format has been transformed into CSV files for convenience. You can download the original JSON files here.
▶️ Run the code cell below to read the transcript data into df_transcript.
# DO NOT CHANGE THE CODE IN THIS CELL
df_transcript = pd.read_csv('https://github.com/bdi475/datasets/raw/main/starbucks-rewards/transcript.v2.csv.gz')

# Used for intermediate checks
df_transcript_backup = df_transcript.copy()

# Print 10 last rows
df_transcript.tail(10)
The table below describes the columns in df_transcript.
| Field | Description |
|---|---|
| member_id | Member ID |
| event | Type of event (‘offer received’, ‘offer completed’, ‘transaction’) |
| time | Time as continuous value |
| offer_id | Offer ID |
| amount | Amount of purchase or NaN if non-purchase |
🎯 Part 2: Find the Number of Rows and Columns
👇 Tasks
✔️ Store the number of rows in
df_transcriptto a new variable namednum_rows.✔️ Store the number of columns in
df_transcriptto a new variable namednum_cols.✔️ Use
.shape, notlen().
# YOUR CODE BEGINS

# YOUR CODE ENDS

print(f"Number of rows: {num_rows}")
print(f"Number of columns: {num_cols}")
🧭 Check Your Work
Run the code cell below to test your solution.
✔️ If the code cell runs without errors, you’re good to move on.
❌ If the code cell produces an error, review your code and fix any mistakes.
# DO NOT CHANGE THE CODE IN THIS CELL
_test_case = 'part-02'
_points = 2

tc.assertEqual(num_rows, len(df_transcript_backup.index), f"Number of rows should be {len(df_transcript_backup.index)}")
tc.assertEqual(num_cols, len(df_transcript_backup.columns), f"Number of columns should be {len(df_transcript_backup.columns)}")
🎯 Part 3: Find Unique Event Types
👇 Tasks
✔️ Using
df_transcript, find the unique list of event types.✔️ In other words, find the unique values in the
eventcolumn.✔️ Store the result in a new variable named
unique_events.✔️
unique_eventscan either be a Pythonlistor a PandasSeries.
🚀 Sample Code
unique_values = my_dataframe['my_column'].unique()# YOUR CODE BEGINS
# YOUR CODE ENDS
print(f'Event types: {unique_events}')🧭 Check Your Work
Run the code cell below to test your solution.
✔️ If the code cell runs without errors, you’re good to move on.
❌ If the code cell produces an error, review your code and fix any mistakes.
# DO NOT CHANGE THE CODE IN THIS CELL
_test_case = 'part-03'
_points = 3

unique_set = set(unique_events)
unique_CHECK = pd.Series(['received', 'viewed', 'completed'])
unique_CHECK = 'offer ' + unique_CHECK
unique_CHECK = pd.concat([unique_CHECK, pd.Series(['transaction'])])

tc.assertEqual(unique_set, set(unique_CHECK))
🎯 Part 4: Find All Customer Purchases
There are four event types. For now, we’ll focus only on customer purchases (transactions).
👇 Tasks
✔️ Using
df_transcript, find rows where theeventis"transaction".We’re excluding any events related to loyalty offers for now.
✔️ Store the filtered rows in
df_transactions.✔️
df_transcriptshould remain unaltered.
# YOUR CODE BEGINS

# YOUR CODE ENDS

df_transactions.head(3)
🔑 Expected Output of df_transactions.head(3)
| member_id | event | time | offer_id | amount | |
|---|---|---|---|---|---|
| 12654 | 02c083884c7d45b39cc68e1314fec56c | transaction | 0 | NaN | 0.83 |
| 12657 | 9fa9ae8f57894cc9a3b8a9bbe0fc1b2f | transaction | 0 | NaN | 34.56 |
| 12659 | 54890f68699049c2a04d415abc25e717 | transaction | 0 | NaN | 13.23 |
🧭 Check Your Work
Run the code cell below to test your solution.
✔️ If the code cell runs without errors, you’re good to move on.
❌ If the code cell produces an error, review your code and fix any mistakes.
# DO NOT CHANGE THE CODE IN THIS CELL
_test_case = 'part-04'
_points = 3

# df_you should remain unaltered
pd.testing.assert_frame_equal(df_transcript, df_transcript_backup, "The original DataFrame should remain unaltered")

# Check result
pd.testing.assert_frame_equal(df_transactions.sort_values(df_transactions.columns.to_list()).reset_index(drop=True),
                              df_transcript_backup.query('event == "transaction"')
.sort_values(df_transcript_backup.columns.tolist()).reset_index(drop=True))# DO NOT CHANGE THE CODE BELOW
df_transactions = df_transactions.copy()👇 Tasks
✔️ Drop
event,time, andoffer_idcolumns fromdf_transactionsin-place.✔️ You should directly drop the columns from
df_transactionsusing theinplace=Trueoption.
🚀 Hints
Use the following code as a reference.
my_dataframe.drop(columns=["my_column1", "my_column2"], inplace=True)# YOUR CODE BEGINS
# YOUR CODE ENDS
df_transactions.head(3)🔑 Expected Output
| member_id | amount | |
|---|---|---|
| 12654 | 02c083884c7d45b39cc68e1314fec56c | 0.83 |
| 12657 | 9fa9ae8f57894cc9a3b8a9bbe0fc1b2f | 34.56 |
| 12659 | 54890f68699049c2a04d415abc25e717 | 13.23 |
🧭 Check Your Work
Run the code cell below to test your solution.
✔️ If the code cell runs without errors, you’re good to move on.
❌ If the code cell produces an error, review your code and fix any mistakes.
# DO NOT CHANGE THE CODE IN THIS CELL
_test_case = 'part-05'
_points = 3

df_check = df_transcript_backup.query('event == "transaction"')[['member_id', 'amount']]

# Check result
pd.testing.assert_frame_equal(df_transactions.sort_values(df_transactions.columns.to_list()).reset_index(drop=True),
                              df_check.sort_values(df_check.columns.tolist()).reset_index(drop=True))
🎯 Part 6: Count, Mean, Median, and Max Transaction Amount
👇 Tasks
✔️ Find the count, mean (average), max, and median of all purchase amounts.
Use the
amountcolumn indf_transactions.
✔️ Store the calculated results in the following variables:
num_transactions: Number of transactionsamount_mean: Average transaction amountamount_median: Median transaction amountamount_max: Maximum transaction amount
🚀 Hints
len(my_dataframe['my_column'])     # Returns the number of row s
my_dataframe['my_column'].mean()   # Returns the mean of a Series
my_dataframe['my_column'].median() # Returns the median of a Series
my_dataframe['my_column'].max()    # Returns the max of a Series
🔑 Expected Output
138953 transactions
mean=12.78, median=8.89, max=1062.28
# YOUR CODE BEGINS
# YOUR CODE ENDS
print(f'{num_transactions} transactions')
print(f'mean={amount_mean:.2f}, median={amount_median:.2f}, max={amount_max:.2f}')🧭 Check Your Work
Run the code cell below to test your solution.
✔️ If the code cell runs without errors, you’re good to move on.
❌ If the code cell produces an error, review your code and fix any mistakes.
# DO NOT CHANGE THE CODE IN THIS CELL
_test_case = 'part-06'
_points = 4

tc.assertEqual(num_transactions, 138953)
tc.assertAlmostEqual(amount_mean, 12.777356156398204)
tc.assertAlmostEqual(amount_median, 8.89)
tc.assertAlmostEqual(amount_max, 1062.28)
📌 Load Customer Profiles
We want to go further with the purchase data analysis by looking at the customers. Unfortunately, the information we currently have about the customers in each purchase is limited. We only have their unique IDs (e.g., 02c083884c7d45b39cc68e1314fec56c, 9fa9ae8f57894cc9a3b8a9bbe0fc1b2f).
In the next few steps, you’ll read the customer profile data and link it to df_transactions using member_id.
▶️ Run the code cell below to read the customer profile data into df_profiles.
# DO NOT CHANGE THE CODE IN THIS CELL
df_profiles = pd.read_csv('https://github.com/bdi475/datasets/raw/main/starbucks-rewards/profile.csv')

# Used for intermediate checks
df_profiles_backup = df_profiles.copy()

# Print first 10 rows
df_profiles.head(10)
The table below describes the columns in df_profiles.
| Field | Description |
|---|---|
| member_id | Unique identifier for each Starbucks app member |
| gender | Gender (NaN if unknown) |
| age | Age (NaN if unknown) |
| became_member_on | Sign-up date |
| income | Annual income (NaN if unknown) |
🎯 Part 7: Find the Number of Rows and Columns
👇 Tasks
✔️ Store the number of rows in
df_profilestonum_rows.✔️ Store the number of columns in
df_profilestonum_cols.✔️ Use
.shape, notlen().
# YOUR CODE BEGINS

# YOUR CODE ENDS

print(f"Number of rows: {num_rows}")
print(f"Number of columns: {num_cols}")
🧭 Check Your Work
Run the code cell below to test your solution.
✔️ If the code cell runs without errors, you’re good to move on.
❌ If the code cell produces an error, review your code and fix any mistakes.
# DO NOT CHANGE THE CODE IN THIS CELL
_test_case = 'part-07'
_points = 2

tc.assertEqual(num_rows, len(df_profiles_backup.index), f"Number of rows should be {len(df_profiles_backup.index)}")
tc.assertEqual(num_cols, len(df_profiles_backup.columns), f"Number of columns should be {len(df_profiles_backup.columns)}")
🎯 Part 8: Find the Number of Rows with Missing Gender Values
👇 Tasks
✔️ Find the number of rows where the value in the
gendercolumn is missing (NaN).✔️ Store the count in a new variable named
num_missing.
🚀 Hints
df["my_column"].isna()returns a Series of boolean values where rows with missing values returnTrue.my_boolean_series.sum()returns the number ofTruevalues in a boolean Series.Python will convert
Trueto1andFalseto0when performing arithmetic operations on boolean values.
🔑 Expected Output
There are 2175 rows where the gender value is missing.
# YOUR CODE BEGINS

# YOUR CODE ENDS

print(f'There are {num_missing} rows with missing gender value.')
🧭 Check Your Work
Run the code cell below to test your solution.
✔️ If the code cell runs without errors, you’re good to move on.
❌ If the code cell produces an error, review your code and fix any mistakes.
# DO NOT CHANGE THE CODE IN THIS CELL
_test_case = 'part-08'
_points = 3

tc.assertEqual(num_missing, 2175)
🎯 Part 9: Remove Rows with Missing Values
👇 Tasks
✔️ Update
df_profilesso that it only contains rows wheregenderis NOT missing.
🚀 Hints
my_dataframe = my_dataframe[my_dataframe['my_column'].notna()]# YOUR CODE BEGINS
# YOUR CODE ENDS
df_profiles.head(5)🔑 Expected Output
| member_id | gender | age | became_member_on | income | |
|---|---|---|---|---|---|
| 1 | 0610b486422d4921ae7d2bf64640c50b | F | 55.0 | 2017-07-15 | 112000.0 |
| 3 | 78afa995795e4d85b5d9ceeca43f5fef | F | 75.0 | 2017-05-09 | 100000.0 |
| 5 | e2127556f4f64592b11af22de27a7932 | M | 68.0 | 2018-04-26 | 70000.0 |
| 8 | 389bc3fa690240e798340f5a15918d5c | M | 65.0 | 2018-02-09 | 53000.0 |
| 12 | 2eeac8d8feae4a8cad5a6af0499a211d | M | 58.0 | 2017-11-11 | 51000.0 |
🧭 Check Your Work
Run the code cell below to test your solution.
✔️ If the code cell runs without errors, you’re good to move on.
❌ If the code cell produces an error, review your code and fix any mistakes.
# DO NOT CHANGE THE CODE IN THIS CELL
_test_case = 'part-09'
_points = 3

df_check = df_profiles_backup.query('gender == gender')

# Check result
pd.testing.assert_frame_equal(df_profiles.sort_values(df_profiles.columns.to_list()).reset_index(drop=True),
                              df_check.sort_values(df_check.columns.tolist()).reset_index(drop=True))
🎯 Part 10: Find the Number of Rows with Missing Gender Values Again
👇 Tasks
✔️ Create the following three new variables:
num_missing_gender: Number of rows where the value in thegendercolumn is missing (NaN)num_missing_age: Number of rows where the value in theagecolumn is missingnum_missing_income: Number of rows where the value in theincomecolumn is missing
🚀 Hints
# find the number of missing rows in my_column
my_dataframe["my_column"].isna().sum()
# YOUR CODE BEGINS
# YOUR CODE ENDS
print(f'There are {num_missing_gender} rows with missing gender value.')
print(f'There are {num_missing_age} rows with missing age value.')
print(f'There are {num_missing_income} rows with missing income value.')🔑 Expected Output
There are 0 rows with missing gender value.
There are 0 rows with missing age value.
There are 0 rows with missing income value.
🧭 Check Your Work
Run the code cell below to test your solution.
✔️ If the code cell runs without errors, you’re good to move on.
❌ If the code cell produces an error, review your code and fix any mistakes.
# DO NOT CHANGE THE CODE IN THIS CELL
_test_case = 'part-10'
_points = 3

tc.assertEqual(num_missing_gender, 0)
tc.assertEqual(num_missing_age, 0)
tc.assertEqual(num_missing_income, 0)
🎯 Part 11: Merge Profiles into Transactions
▶️ Run the code below to:
Convert
ageandincomecolumns indf_profilesto integer types (from float types).By default, Pandas uses
np.float64data type for numeric columns with missing values even if the values are integers.Now that we have removed all the rows with missing values, we will covert these columns to
np.int64columns.
Print out the first three rows of
df_transactionsanddf_profiles.
# convert age and income to int64 types
df_profiles['age'] = df_profiles['age'].astype(np.int64)
df_profiles['income'] = df_profiles['income'].astype(np.int64)

display(df_transactions.head(3))
display(df_profiles.head(3))
👇 Tasks
✔️ Merge
df_transactionsanddf_profilesusing an inner join type.By using an inner join, we are intentionally removing transactions made by customers with missing gender information.
Don’t worry about the different types of joins yet. Google “pandas types of joins” if you’d like to find out more.
✔️ Place
df_transactionson the “left” side.✔️ Store the merged DataFrame in
df_merged.
🚀 Hints
my_merged_dataframe = pd.merge(
    left=left_dataframe,
    right=right_dataframe,
    on='my_common_column',
    how='inner'
)
# YOUR CODE BEGINS
# YOUR CODE ENDS
df_merged.head(5)🔑 Expected Output
| member_id | amount | gender | age | became_member_on | income | |
|---|---|---|---|---|---|---|
| 0 | 02c083884c7d45b39cc68e1314fec56c | 0.83 | F | 20 | 2016-07-11 | 30000 |
| 1 | 02c083884c7d45b39cc68e1314fec56c | 1.44 | F | 20 | 2016-07-11 | 30000 |
| 2 | 02c083884c7d45b39cc68e1314fec56c | 4.56 | F | 20 | 2016-07-11 | 30000 |
| 3 | 02c083884c7d45b39cc68e1314fec56c | 1.53 | F | 20 | 2016-07-11 | 30000 |
| 4 | 02c083884c7d45b39cc68e1314fec56c | 0.50 | F | 20 | 2016-07-11 | 30000 |
🧭 Check Your Work
Run the code cell below to test your solution.
✔️ If the code cell runs without errors, you’re good to move on.
❌ If the code cell produces an error, review your code and fix any mistakes.
# DO NOT CHANGE THE CODE IN THIS CELL
_test_case = 'part-11'
_points = 5

df_check = df_transcript_backup.query('event == "transaction"').merge(
    df_profiles_backup.query('gender == gender'),
    on='member_id',
    how='inner'
).drop(columns=['event', 'time', 'offer_id'])
df_check['age'] = df_check['age'].astype(np.int64)
df_check['income'] = df_check['income'].astype(np.int64)
df_merged_backup = df_check.copy()

# Check result
pd.testing.assert_frame_equal(df_merged.sort_values(df_merged.columns.to_list()).reset_index(drop=True),
                              df_check.sort_values(df_check.columns.tolist()).reset_index(drop=True))
🎯 Part 12: Average Transaction Amount by Gender
👇 Tasks
✔️ Using
df_merged, find the average transaction amount by gender.✔️ Store the summary DataFrame in
df_mean_by_gender.✔️
df_mean_by_gendershould have two non-index columns.df_mean_by_gender.columns.to_list()should print out['gender', 'amount'].
✔️
df_mergedshould remain unaltered.
🚀 Hints
my_result = df.groupby('some_column', as_index=False).agg({
      'another_column': 'mean'
})
# YOUR CODE BEGINS
# YOUR CODE ENDS
df_mean_by_gender🔑 Expected Output
| gender | amount | |
|---|---|---|
| 0 | F | 17.490077 |
| 1 | M | 11.606600 |
| 2 | O | 14.798731 |
🧭 Check Your Work
Run the code cell below to test your solution.
✔️ If the code cell runs without errors, you’re good to move on.
❌ If the code cell produces an error, review your code and fix any mistakes.
# DO NOT CHANGE THE CODE IN THIS CELL
_test_case = 'part-12'
_points = 4

df_check = pd.DataFrame({'gender': {0: 'F', 1: 'M', 2: 'O'},
 'amount': {0: 17.490077356121578,
  1: 11.606600269252956,
  2: 14.798731049971932}})

# Check result
tc.assertEqual(df_merged.shape, df_merged_backup.shape)
pd.testing.assert_frame_equal(df_mean_by_gender.sort_values(df_mean_by_gender.columns.to_list()).reset_index(drop=True),
                              df_check.sort_values(df_check.columns.tolist()).reset_index(drop=True))
🎯 Part 13: Multiple Statistics by Gender
We already can see that females spend more on average than other genders. Your goal is to expand the analysis that you just did to derive more insights.
👇 Tasks
✔️ Using
df_merged, find the following statistics by gender:count: Number of transactionsmean: Average amount of transactionsmedian: Median amountsum: Total amount of transactionsstd: Standard deviation of transactions
✔️ Store the summary DataFrame in
df_stats_by_gender.✔️
df_stats_by_gendershould have six non-index columns.print(df_stats_by_gender.columns.to_list())should print out['gender', 'count', 'mean', 'median', 'sum', 'std'].
✔️
df_mergedshould remain unaltered.
🚀 Hints
my_result = my_dataframe.groupby('my_column', as_index=False).agg({
    'some_column': ['count', 'mean', 'median', 'sum', 'std']
})

# rename columns with a flat list
# replace ... with your own strings
my_result.columns = ['gender', 'count', ..., ..., ..., ...]
# YOUR CODE BEGINS
# YOUR CODE ENDS
print(df_stats_by_gender.columns.to_list())
display(df_stats_by_gender)🔑 Expected Output
| gender | count | mean | median | sum | std | |
|---|---|---|---|---|---|---|
| 0 | F | 49382 | 17.490077 | 15.00 | 863695.00 | 35.342611 |
| 1 | M | 72794 | 11.606600 | 7.05 | 844890.86 | 28.964542 |
| 2 | O | 1781 | 14.798731 | 13.30 | 26356.54 | 25.748149 |
🧭 Check Your Work
Run the code cell below to test your solution.
✔️ If the code cell runs without errors, you’re good to move on.
❌ If the code cell produces an error, review your code and fix any mistakes.
# DO NOT CHANGE THE CODE IN THIS CELL
_test_case = 'part-13'
_points = 7

df_check = pd.DataFrame({'gender': ['F', 'M', 'O'], 'count': [49382, 72794, 1781],
 'mean': [17.490077356121663, 11.60660026925296, 14.798731049971927],
 'median': [15.0, 7.05, 13.3], 'sum': [863695.0, 844890.86, 26356.54],
 'std': [35.34261142117411, 28.96454214855915, 25.74814916149888]})

# Check result
pd.testing.assert_frame_equal(df_stats_by_gender.sort_values(df_stats_by_gender.columns.to_list()).reset_index(drop=True),
                              df_check.sort_values(df_check.columns.tolist()).reset_index(drop=True))
🎯 Part 14: Create Age Groups
Next, you would like to find out the average transaction amount by different age groups(e.g., 10-20, 20-30, 30-40, etc). To perform that analysis, we’ll create a new column containing the age group information.
A fully working code is given to you since we haven’t learned pd.cut() in class. 🦊 pd.cut() converts numerical values into a set of categorical values.
👇 Tasks
✔️ Copy and run the code below.
df_merged['age_group'] = pd.cut(
    df_merged['age'],
    bins=[10, 20, 30, 40, 50, 999],
    labels=['10-20', '20-30', '30-40', '40-50', '50>']
)
# YOUR CODE BEGINS
# YOUR CODE ENDS
df_merged.head(5)🔑 Expected Output
| member_id | amount | gender | age | became_member_on | income | age_group | |
|---|---|---|---|---|---|---|---|
| 0 | 02c083884c7d45b39cc68e1314fec56c | 0.83 | F | 20 | 2016-07-11 | 30000 | 10-20 |
| 1 | 02c083884c7d45b39cc68e1314fec56c | 1.44 | F | 20 | 2016-07-11 | 30000 | 10-20 |
| 2 | 02c083884c7d45b39cc68e1314fec56c | 4.56 | F | 20 | 2016-07-11 | 30000 | 10-20 |
| 3 | 02c083884c7d45b39cc68e1314fec56c | 1.53 | F | 20 | 2016-07-11 | 30000 | 10-20 |
| 4 | 02c083884c7d45b39cc68e1314fec56c | 0.50 | F | 20 | 2016-07-11 | 30000 | 10-20 |
🧭 Check Your Work
Run the code cell below to test your solution.
✔️ If the code cell runs without errors, you’re good to move on.
❌ If the code cell produces an error, review your code and fix any mistakes.
# DO NOT CHANGE THE CODE IN THIS CELL
_test_case = 'part-14'
_points = 3

df_check = df_merged.copy()
age_groups = ['50>', '40-50', '30-40', '20-30', '10-20']
age_groups.reverse()
df_check['age_group'] = pd.cut(
    df_check['AGE'.lower()],
    bins=[x * 10 for x in [1, 2, 3, 4, 5]] + [1000],
    labels=age_groups
)

# Check result
pd.testing.assert_frame_equal(df_merged.sort_values(df_merged.columns.to_list()).reset_index(drop=True),
                              df_check.sort_values(df_check.columns.tolist()).reset_index(drop=True))
🎯 Part 15: Average Transaction Amount by Age Group
👇 Tasks
✔️ Using
df_merged, find the average transaction amount by age group (age_groupcolumn).✔️ Store the summary DataFrame in
df_mean_by_age_group.✔️
df_mean_by_age_groupshould contain two non-index columns.df_mean_by_age_group.columns.to_list()should print out['age_group', 'amount'].
✔️
df_mergedshould remain unaltered.
# YOUR CODE BEGINS

# YOUR CODE ENDS

df_mean_by_age_group
🔑 Expected Output
| age_group | amount | |
|---|---|---|
| 0 | 10-20 | 7.48039 |
| 1 | 20-30 | 8.40717 |
| 2 | 30-40 | 10.252 |
| 3 | 40-50 | 13.4737 |
| 4 | 50> | 16.4099 |
🧭 Check Your Work
Run the code cell below to test your solution.
✔️ If the code cell runs without errors, you’re good to move on.
❌ If the code cell produces an error, review your code and fix any mistakes.
# DO NOT CHANGE THE CODE IN THIS CELL
_test_case = 'part-15'
_points = 4

df_check = pd.DataFrame({'age_group': {0: '10-20', 1: '20-30', 2: '30-40', 3: '40-50', 4: '50>'},
 'amount': {0: 7.4803926701570775, 1: 8.407165820643007, 2: 10.251975269699113, 3: 13.473675454312783, 4: 16.40988963903655}})
df_mean_by_age_group_copy = df_mean_by_age_group.copy()
df_mean_by_age_group_copy['age_group'] = df_mean_by_age_group_copy['age_group'].astype(str)
# Check result
pd.testing.assert_frame_equal(df_mean_by_age_group_copy.sort_values(df_mean_by_age_group_copy.columns.to_list()).reset_index(drop=True),
                              df_check.sort_values(df_check.columns.tolist()).reset_index(drop=True))
🎯 Part 16: Multiple Statistics by Age Group
👇 Tasks
✔️ Using
df_merged, find the following statistics by age group:count: Number of transactionsmean: Average amount of transactionsmedian: Median amountsum: Total amount of transactionsstd: Standard deviation of transactions
✔️ Store the summary DataFrame in
df_stats_by_age_group.✔️
df_stats_by_age_groupshould have six non-index columns.print(df_stats_by_age_group.columns.to_list())should print out['age_group', 'count', 'mean', 'median', 'sum', 'std'].
✔️
df_mergedshould remain unaltered.
🚀 Hints
my_result = my_dataframe.groupby('my_column', as_index=False).agg({
    'some_column': ['count', 'mean', 'median', 'sum', 'std']
})

# rename columns with a flat list
# replace ... with your own strings
my_result.columns = ['gender', 'count', ..., ..., ..., ...]
# YOUR CODE BEGINS
# YOUR CODE ENDS
print(df_stats_by_age_group.columns.to_list())
display(df_stats_by_age_group)🔑 Expected Output
| age_group | count | mean | median | sum | std | |
|---|---|---|---|---|---|---|
| 0 | 10-20 | 3438 | 7.480393 | 4.345 | 25717.59 | 18.218205 |
| 1 | 20-30 | 14184 | 8.407166 | 4.920 | 119247.24 | 22.433536 |
| 2 | 30-40 | 15851 | 10.251975 | 6.650 | 162504.06 | 25.777848 |
| 3 | 40-50 | 19535 | 13.473675 | 11.040 | 263208.25 | 26.798969 |
| 4 | 50> | 70949 | 16.409890 | 13.980 | 1164265.26 | 35.790405 |
🧭 Check Your Work
Run the code cell below to test your solution.
✔️ If the code cell runs without errors, you’re good to move on.
❌ If the code cell produces an error, review your code and fix any mistakes.
# DO NOT CHANGE THE CODE IN THIS CELL
_test_case = 'part-16'
_points = 7

df_check = pd.DataFrame({'age_group': pd.Categorical(['10-20', '20-30', '30-40', '40-50', '50>'],
                        categories=['10-20', '20-30', '30-40', '40-50', '50>'], ordered=True),
 'count': [3438, 14184, 15851, 19535, 70949], 'mean': [7.480392670157068, 8.407165820642978, 10.251975269699072,
  13.473675454312772, 16.409889639036493], 'median': [4.345, 4.92, 6.65, 11.04, 13.98],
 'sum': [25717.59, 119247.24, 162504.06, 263208.25, 1164265.26], 'std': [18.218205201054083,
  22.43353563734416, 25.777847730288666, 26.798968600597718, 35.79040508301137]})

# Check result
pd.testing.assert_frame_equal(df_stats_by_age_group.sort_values(df_stats_by_age_group.columns.to_list()).reset_index(drop=True),
                              df_check.sort_values(df_check.columns.tolist()).reset_index(drop=True))
🎯 Part 17: Create Income Range Groups
We’re going to repeat the previous method on customers’ income.
👇 Tasks
✔️ Copy and run the code below.
df_merged['income_group'] = pd.cut(
    df_merged['income'],
    bins=[0, 40000, 60000, 80000, 100000, 999999],
    labels=['<40k', '40k-60k', '60k-80k', '80k-100k', '>100k']
)
# YOUR CODE BEGINS
# YOUR CODE ENDS
df_merged.head(5)🔑 Expected Output
| member_id | amount | gender | age | became_member_on | income | age_group | income_group | |
|---|---|---|---|---|---|---|---|---|
| 0 | 02c083884c7d45b39cc68e1314fec56c | 0.83 | F | 20 | 2016-07-11 | 30000 | 10-20 | <40k |
| 1 | 02c083884c7d45b39cc68e1314fec56c | 1.44 | F | 20 | 2016-07-11 | 30000 | 10-20 | <40k |
| 2 | 02c083884c7d45b39cc68e1314fec56c | 4.56 | F | 20 | 2016-07-11 | 30000 | 10-20 | <40k |
| 3 | 02c083884c7d45b39cc68e1314fec56c | 1.53 | F | 20 | 2016-07-11 | 30000 | 10-20 | <40k |
| 4 | 02c083884c7d45b39cc68e1314fec56c | 0.5 | F | 20 | 2016-07-11 | 30000 | 10-20 | <40k |
🧭 Check Your Work
Run the code cell below to test your solution.
✔️ If the code cell runs without errors, you’re good to move on.
❌ If the code cell produces an error, review your code and fix any mistakes.
# DO NOT CHANGE THE CODE IN THIS CELL
_test_case = 'part-17'
_points = 3

df_check = df_merged.copy()
income_groups = ['>100k', '80k-100k', '60k-80k', '40k-60k', '<40k']
income_groups.reverse()
df_check['income_group'] = pd.cut(
    df_check['INCOME'.lower()],
    bins=[x * 10000 for x in [0, 4, 6, 8, 10]] + [999999],
    labels=income_groups
)
# Check result
pd.testing.assert_frame_equal(df_merged.sort_values(df_merged.columns.to_list()).reset_index(drop=True),
                              df_check.sort_values(df_check.columns.tolist()).reset_index(drop=True))
🎯 Part 18: Average Transaction Amount by Income Group
👇 Tasks
✔️ Using
df_merged, find the average transaction amount by income group (income_groupcolumn).✔️ Store the summary DataFrame in
df_mean_by_income_group.✔️
df_mean_by_income_groupshould contain two non-index columns.df_mean_by_income_group.columns.to_list()should print out['income_group', 'amount'].
✔️
df_mergedshould remain unaltered.
# YOUR CODE BEGINS

# YOUR CODE ENDS

df_mean_by_income_group
🔑 Expected Output
| income_group | amount | |
|---|---|---|
| 0 | <40k | 6.19841 |
| 1 | 40k-60k | 9.3538 |
| 2 | 60k-80k | 15.1868 |
| 3 | 80k-100k | 27.4484 |
| 4 | >100k | 30.897 |
🧭 Check Your Work
Run the code cell below to test your solution.
✔️ If the code cell runs without errors, you’re good to move on.
❌ If the code cell produces an error, review your code and fix any mistakes.
# DO NOT CHANGE THE CODE IN THIS CELL
_test_case = 'part-18'
_points = 4

df_check = pd.DataFrame({'income_group': {0: '<40k',  1: '40k-60k', 2: '60k-80k', 3: '80k-100k',
  4: '>100k'}, 'amount': {0: 6.198411429621467, 1: 9.353795970427743, 2: 15.186842961106798,
  3: 27.44839995065385, 4: 30.897049126815634}})
df_mean_by_income_group_copy = df_mean_by_income_group.copy()
df_mean_by_income_group_copy['income_group'] = df_mean_by_income_group_copy['income_group'].astype(str)
# Check result
pd.testing.assert_frame_equal(df_mean_by_income_group_copy.sort_values(df_mean_by_income_group_copy.columns.to_list()).reset_index(drop=True),
                              df_check.sort_values(df_check.columns.tolist()).reset_index(drop=True))
🎯 Part 19: Multiple Statistics by Income Group
👇 Tasks
✔️ Using
df_merged, find the following statistics by income group:count: Number of transactionsmean: Average amount of transactionsmedian: Median amountsum: Total amount of transactionsstd: Standard deviation of transactions
✔️ Store the summary DataFrame in
df_stats_by_income_group.✔️
df_stats_by_income_groupshould have six non-index columns.print(df_stats_by_income_group.columns.to_list())should print out['income_group', 'count', 'mean', 'median', 'sum', 'std'].
✔️
df_mergedshould remain unaltered.
# YOUR CODE BEGINS

# YOUR CODE ENDS

print(df_stats_by_income_group.columns.to_list())
display(df_stats_by_income_group)
🔑 Expected Output
| income_group | count | mean | median | sum | std | |
|---|---|---|---|---|---|---|
| 0 | <40k | 21768 | 6.198411 | 4.30 | 134927.02 | 14.279654 |
| 1 | 40k-60k | 42337 | 9.353796 | 6.97 | 396011.66 | 20.842805 |
| 2 | 60k-80k | 37513 | 15.186843 | 14.01 | 569704.04 | 29.959209 |
| 3 | 80k-100k | 16212 | 27.448400 | 23.26 | 444993.46 | 51.150685 |
| 4 | >100k | 6127 | 30.897049 | 26.57 | 189306.22 | 55.785360 |
🧭 Check Your Work
Run the code cell below to test your solution.
✔️ If the code cell runs without errors, you’re good to move on.
❌ If the code cell produces an error, review your code and fix any mistakes.
# DO NOT CHANGE THE CODE IN THIS CELL
_test_case = 'part-19'
_points = 7

df_check = pd.DataFrame({'income_group': ['<40k', '40k-60k', '60k-80k', '80k-100k', '>100k'],
 'count': [21768, 42337, 37513, 16212, 6127], 'mean': [6.198411429621462,  9.353795970427758,
  15.186842961106818, 27.448399950653837, 30.897049126815734], 'median': [4.3, 6.97, 14.01, 23.26, 26.57],
 'sum': [134927.02, 396011.66, 569704.04, 444993.46, 189306.22],'std': [14.279653533711084,
  20.842804835779052, 29.95920866138207, 51.150685436236365, 55.78535978944457]})
df_stats_by_income_group_copy = df_stats_by_income_group.copy()
df_stats_by_income_group_copy['income_group'] = df_stats_by_income_group_copy['income_group'].astype(str)
# Check result
pd.testing.assert_frame_equal(df_stats_by_income_group_copy.sort_values(df_stats_by_income_group_copy.columns.to_list()).reset_index(drop=True),
                              df_check.sort_values(df_check.columns.tolist()).reset_index(drop=True))
🎯 Part 20: Multiple Statistics by Gender and Age Group
👇 Tasks
✔️ Using
df_merged, find the following statistics by both gender and age group (combined):count: Number of transactionsmean: Average amount of transactionsmedian: Median amountsum: Total amount of transactionsstd: Standard deviation of transactions
✔️ Store the summary DataFrame in
df_stats_by_gender_and_age_group.✔️
df_stats_by_gender_and_age_groupshould have seven non-index columns.print(df_stats_by_gender_and_age_group.columns.to_list())should print out['gender', 'age_group', 'count', 'mean', 'median', 'sum', 'std'].
✔️
df_mergedshould remain unaltered.
🚀 Sample code
my_result = my_dataframe.groupby(['my_column1', 'my_column2'], as_index=False).agg({
    'some_column': ['count', 'mean', 'median', 'sum', 'std']
})

# rename columns with a flat list
# replace ... with your own strings
my_result.columns = ['gender', 'age_group', 'count', ..., ..., ..., ...]
# YOUR CODE BEGINS
# YOUR CODE ENDS
print(df_stats_by_gender_and_age_group.columns.to_list())
display(df_stats_by_gender_and_age_group)🔑 Expected Output
| gender | age_group | count | mean | median | sum | std | |
|---|---|---|---|---|---|---|---|
| 0 | F | 10-20 | 876 | 9.772363 | 8.200 | 8560.59 | 16.684214 |
| 1 | F | 20-30 | 4410 | 11.390574 | 8.300 | 50232.43 | 29.497469 |
| 2 | F | 30-40 | 5369 | 12.562378 | 10.270 | 67447.41 | 25.669856 |
| 3 | F | 40-50 | 7133 | 16.735238 | 14.650 | 119372.45 | 31.372290 |
| 4 | F | 50> | 31594 | 19.563275 | 17.290 | 618082.12 | 38.388897 |
| 5 | M | 10-20 | 2517 | 6.633190 | 3.560 | 16695.74 | 18.791151 |
| 6 | M | 20-30 | 9618 | 7.052608 | 3.930 | 67831.98 | 18.351805 |
| 7 | M | 30-40 | 10258 | 9.015572 | 4.940 | 92481.74 | 25.999063 |
| 8 | M | 40-50 | 12079 | 11.517318 | 8.100 | 139117.69 | 23.831984 |
| 9 | M | 50> | 38322 | 13.797915 | 10.090 | 528763.71 | 33.354972 |
| 10 | O | 10-20 | 45 | 10.250222 | 9.580 | 461.26 | 6.761075 |
| 11 | O | 20-30 | 156 | 7.582244 | 6.075 | 1182.83 | 6.015835 |
| 12 | O | 30-40 | 224 | 11.495134 | 10.550 | 2574.91 | 8.773994 |
| 13 | O | 40-50 | 323 | 14.607152 | 13.730 | 4718.11 | 9.186122 |
| 14 | O | 50> | 1033 | 16.862953 | 14.880 | 17419.43 | 32.828666 |
🧭 Check Your Work
Run the code cell below to test your solution.
✔️ If the code cell runs without errors, you’re good to move on.
❌ If the code cell produces an error, review your code and fix any mistakes.
# DO NOT CHANGE THE CODE IN THIS CELL
_test_case = 'part-20'
_points = 8

df_check = pd.DataFrame({'gender': ['F', 'F', 'F', 'F', 'F', 'M', 'M', 'M', 'M', 'M', 'O', 'O', 'O', 'O', 'O'],
  'age_group': ['10-20', '20-30', '30-40', '40-50', '50>', '10-20', '20-30', '30-40', '40-50', '50>', '10-20',
  '20-30', '30-40', '40-50', '50>'], 'count': [876, 4410, 5369, 7133, 31594, 2517, 9618, 10258, 12079, 38322, 45,
  156, 224, 323, 1033], 'mean': [9.8, 11.4, 12.6, 16.7, 19.6, 6.6, 7.1, 9.0, 11.5, 13.8, 10.3, 7.6, 11.5, 14.6, 16.9],
  'median': [8.2, 8.3, 10.3, 14.6, 17.3, 3.6, 3.9, 4.9, 8.1, 10.1, 9.6, 6.1, 10.6, 13.7, 14.9], 'sum': [8560.6,
  50232.4, 67447.4, 119372.4, 618082.1, 16695.7, 67832.0, 92481.7, 139117.7, 528763.7, 461.3, 1182.8, 2574.9,
  4718.1, 17419.4], 'std': [16.7, 29.5, 25.7, 31.4, 38.4, 18.8, 18.4, 26.0, 23.8, 33.4, 6.8, 6.0, 8.8, 9.2, 32.8]})
df_stats_by_gender_and_age_group = df_stats_by_gender_and_age_group.copy()
df_stats_by_gender_and_age_group['age_group'] = df_stats_by_gender_and_age_group['age_group'].astype(str)
# Check result
pd.testing.assert_frame_equal(df_stats_by_gender_and_age_group.round(1).sort_values(df_stats_by_gender_and_age_group.columns.to_list()).reset_index(drop=True),
                              df_check.sort_values(df_check.columns.tolist()).reset_index(drop=True))
🍸 Submitting Your Notebook
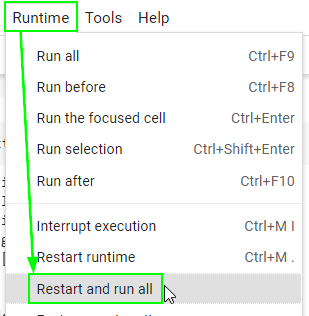
There is one final step before exporting the notebook as an .ipynb file for submission. Restart your runtime (kernal) and run all cells from the beginning to ensure that your notebook does not contain any errors.
Go to the “Runtime” menu (“Kernel” if you’re on Jupyter Lab) at the top.
Select “Restart and run all”.
Make sure no code cell throws an error.
Failing to pass this step may result in a significant loss of points since the autograder will fail to run.
print('🎯 Restart and run all successful')